Deck 2: Linear and Quadratic Functions
Full screen (f)
Question
Question
Question
Question
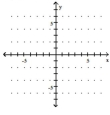
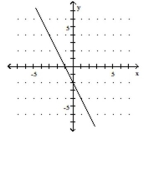
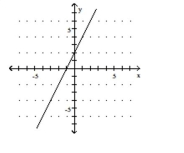
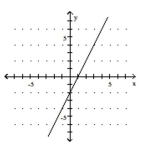
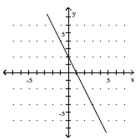
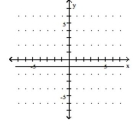
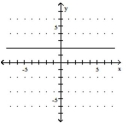
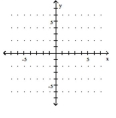
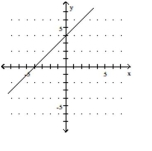
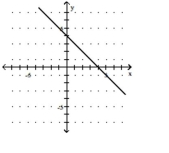
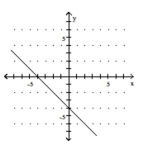
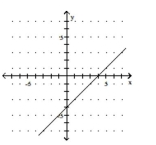
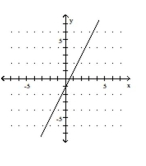
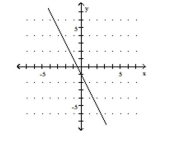
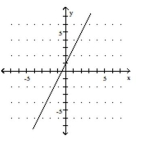
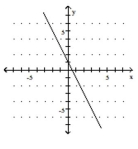
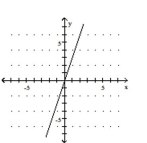
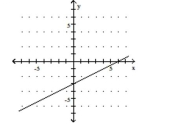
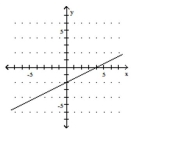
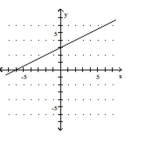
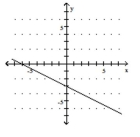
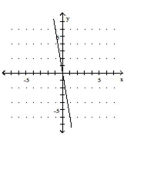
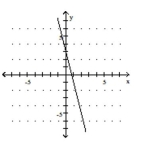
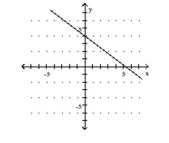
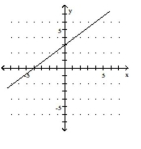
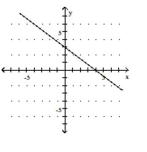
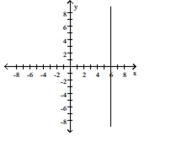
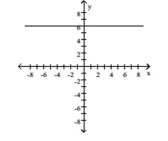
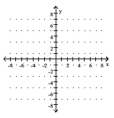
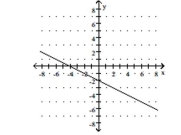
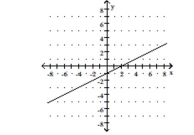
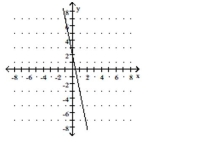
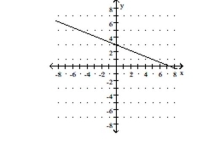
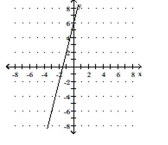
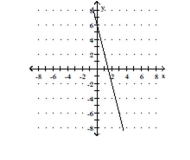
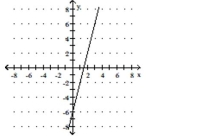
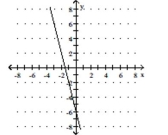
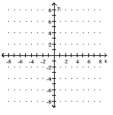
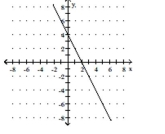
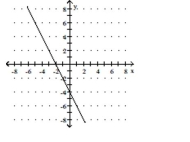
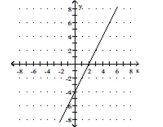
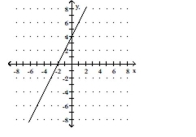
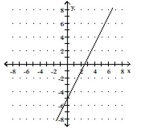
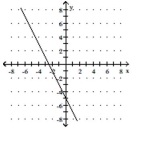
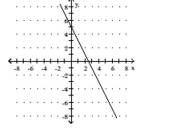
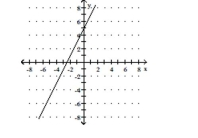
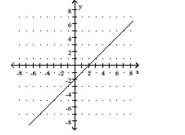
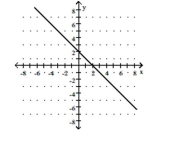
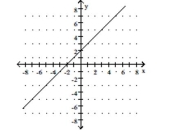
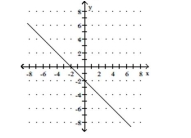
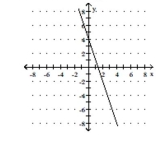
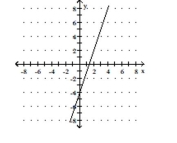
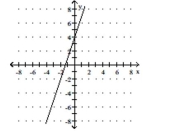
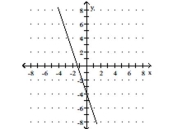
Use the slope and y-intercept to graph the linear function.
-
A)
B)
C)
D)
-
A)
B)
C)
D)
Question
Question
Use the slope and y-intercept to graph the linear function.
-
A)
B)
C)
D)
-
A)
B)
C)
D)
Question
Question
Use the slope and y-intercept to graph the linear function.
-
A)
B)
C)
D)
-
A)
B)
C)
D)
Question
Question
Question
Use the slope and y-intercept to graph the linear function.
-
A)
B)
C)
D)
-
A)
B)
C)
D)
Question
Question
Use the slope and y-intercept to graph the linear function.
-
A)
B)
C)
D)
-
A)
B)
C)
D)
Question
Question
Question
Use the slope and y-intercept to graph the linear function.
-
A)
B)
C)
D)
-
A)
B)
C)
D)
Question
Use the slope and y-intercept to graph the linear function.
-
A)
B)
C)
D)
-
A)
B)
C)
D)
Question
Question
Question
Use the slope and y-intercept to graph the linear function.
-
A)
B)
C)
D)
-
A)
B)
C)
D)
Question
Question
Question
Question
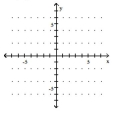
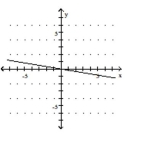
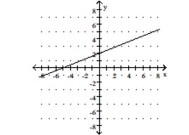
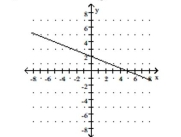
Graph the function. State whether it is increasing, decreasing, or constant..
-
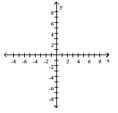
A) constant
B) constant
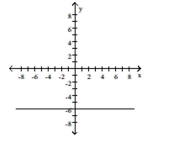
C) decreasing
D) constant
-
A) constant
B) constant
C) decreasing
D) constant
Question
Question
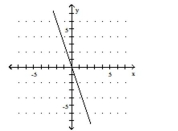
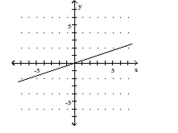
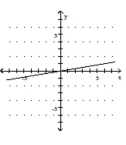
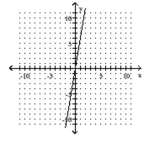
Graph the function. State whether it is increasing, decreasing, or constant..
-
A) increasing
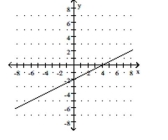
B) increasing
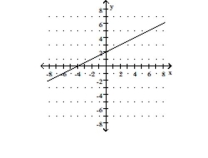
C) decreasing
D) increasing
-
A) increasing
B) increasing
C) decreasing
D) increasing
Question
Question
Question
Question
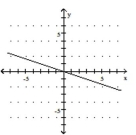
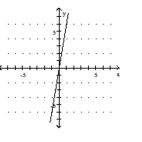
Graph the function. State whether it is increasing, decreasing, or constant..
-
A) decreasing
B) decreasing
C) increasing
D) decreasing
-
A) decreasing
B) decreasing
C) increasing
D) decreasing
Question
Question
Graph the function. State whether it is increasing, decreasing, or constant..
-
A) increasing
B) decreasing
C) increasing
D) decreasing
-
A) increasing
B) decreasing
C) increasing
D) decreasing
Question
Graph the function. State whether it is increasing, decreasing, or constant..
-
A) decreasing
B) increasing
C) increasing
D) increasing
-
A) decreasing
B) increasing
C) increasing
D) increasing
Question
Graph the function. State whether it is increasing, decreasing, or constant..
-
A) increasing
B) decreasing
C) decreasing
D) increasing
-
A) increasing
B) decreasing
C) decreasing
D) increasing
Question
Question
Question
Question
Question
Graph the function. State whether it is increasing, decreasing, or constant..
-
A) increasing
B) decreasing
C) increasing
D) decreasing
-
A) increasing
B) decreasing
C) increasing
D) decreasing
Question
Graph the function. State whether it is increasing, decreasing, or constant..
-
A) decreasing
B) increasing
C) increasing
D) decreasing
-
A) decreasing
B) increasing
C) increasing
D) decreasing
Question
Question
Question
Question
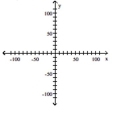
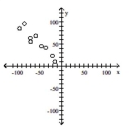
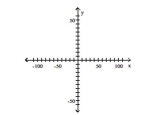
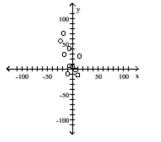
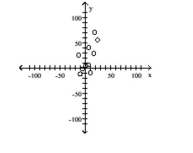
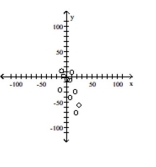
Plot a scatter diagram.
-
A)
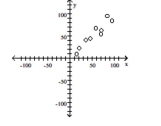
B)
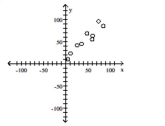
C)
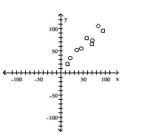
D)
-
A)
B)
C)
D)
Question
Question
Plot a scatter diagram.
-
A)
B)
C)
D)
-
A)
B)
C)
D)
Question
Question
Solve the problem.
Let f(x) be the function represented by the dashed line and g(x) be the function represented by the solid line. Solve the equation f(x) = g(x).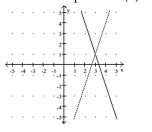
A) x = -3
B) x = -1
C) x = 1
D) x = 3
Let f(x) be the function represented by the dashed line and g(x) be the function represented by the solid line. Solve the equation f(x) = g(x).
A) x = -3
B) x = -1
C) x = 1
D) x = 3
Question
Question
Question
Question
Question
Question
Question
Solve the problem.
-Let f(x) be the function represented by the dashed line and g(x) be the function represented by the solid line. Solve the equation f(x)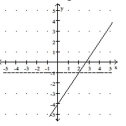
A)
B)
C)
D)
-Let f(x) be the function represented by the dashed line and g(x) be the function represented by the solid line. Solve the equation f(x)
A)
B)
C)
D)
Question
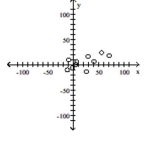
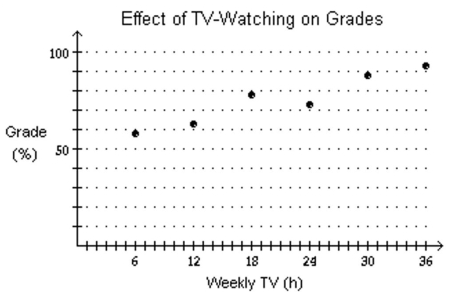
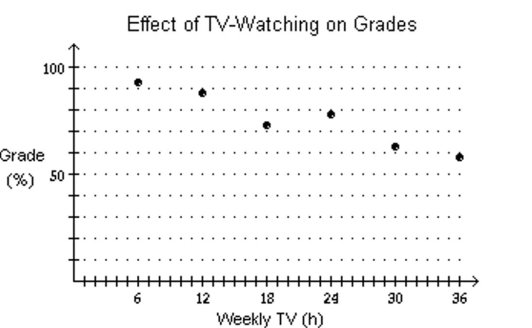
Plot and interpret the appropriate scatter diagram.
-The table gives the times spent watching TV and the grades of several students.
Which scatter diagram describes the data and the relationship, if any?
A)
More hours spent watching TV may reduce grades.
B)
More hours spent watching TV may increase grades.
C)
More hours spent watching TV may reduce grades.
D) none of these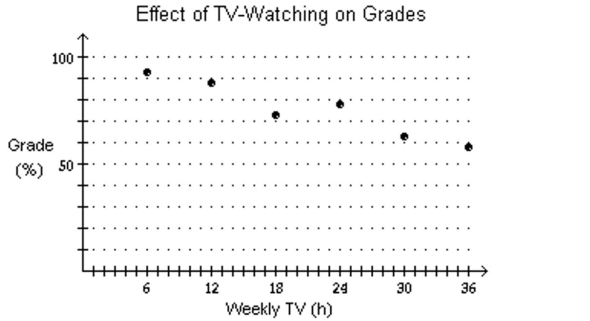
Question
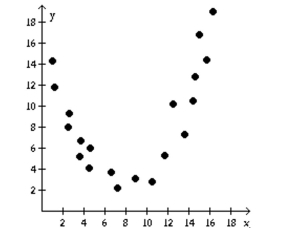
Plot and interpret the appropriate scatter diagram.
The table shows the study times and test scores for a number of students. Draw a scatter plot of score versus time
treating time as the independent variable.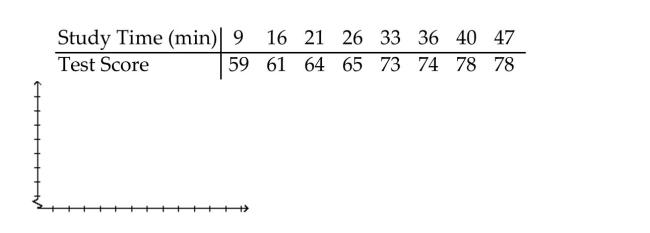
The table shows the study times and test scores for a number of students. Draw a scatter plot of score versus time
treating time as the independent variable.
Question
Solve the problem.
Let f(x) be the function represented by the dashed line and g(x) be the function represented by the solid line. Solve the equation f(x) < g(x).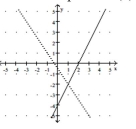
A) x < 1
B) x > -2
C) x > 1
D) x < -2
Let f(x) be the function represented by the dashed line and g(x) be the function represented by the solid line. Solve the equation f(x) < g(x).
A) x < 1
B) x > -2
C) x > 1
D) x < -2
Question
Question
Question
Solve the problem.
-The following scatter diagram shows heights (in inches) of children and their ages.
Age (years) What is the expected height range for a 2-year old child?
A) 40-50 inches
B) 35-45 inches
C) 25-38 inches
D) 20-30 inches
-The following scatter diagram shows heights (in inches) of children and their ages.
Age (years) What is the expected height range for a 2-year old child?
A) 40-50 inches
B) 35-45 inches
C) 25-38 inches
D) 20-30 inches
Question
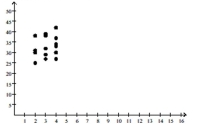
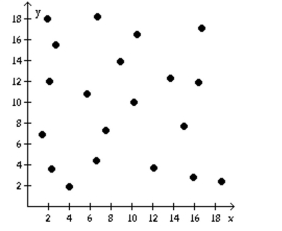
Determine if the type of relation is linear, nonlinear, or none.
A) none
B) nonlinear
C) linear
A) none
B) nonlinear
C) linear
Question
Solve the problem.
-The following scatter diagram shows heights (in inches) of children and their ages.
Age (years) Based on this data, how old do you think a child is who is about 39 inches tall?
A) 3 months
B) 1 year
C) 3 years
D) 7 years
-The following scatter diagram shows heights (in inches) of children and their ages.
Age (years) Based on this data, how old do you think a child is who is about 39 inches tall?
A) 3 months
B) 1 year
C) 3 years
D) 7 years
Question
Question
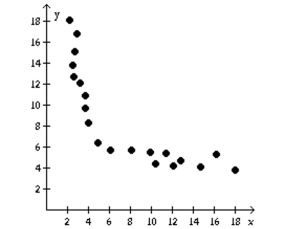
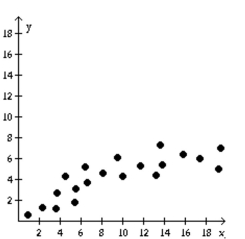
Determine if the type of relation is linear, nonlinear, or none.
A) linear
B) none
C) nonlinear
A) linear
B) none
C) nonlinear
Question
Question
Question
Question
Question
Solve the problem.
-The following scatter diagram shows heights (in inches) of children and their ages.
Age (years)
What happens to height as age increases?
A) Height stays the same as age increases.
B) Height and age do not appear to be related.
C) Height increases as age increases.
D) Height decreases as age increases.
Question
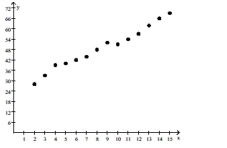
Plot and interpret the appropriate scatter diagram.
The one-day temperatures for 12 world cities along with their latitudes are shown in the table below. Make a
scatter diagram for the data. Describe what happens to the one-day temperatures as the latitude increases.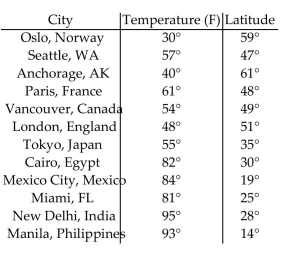 Latitude (degrees)
  Temperature (F)°
The one-day temperatures for 12 world cities along with their latitudes are shown in the table below. Make a
scatter diagram for the data. Describe what happens to the one-day temperatures as the latitude increases.
Latitude (degrees) Temperature (F)° Question
Question
Question
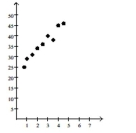
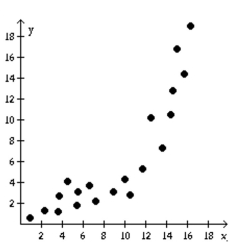
Determine if the type of relation is linear, nonlinear, or none.
A) none
B) linear
C) nonlinear
A) none
B) linear
C) nonlinear
Question
Question
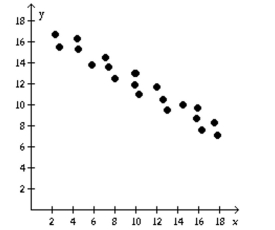
Determine if the type of relation is linear, nonlinear, or none.
A) none
B) linear
C) nonlinear
A) none
B) linear
C) nonlinear
Question
Question
Determine if the type of relation is linear, nonlinear, or none.
A) nonlinear
B) none
C) linear
A) nonlinear
B) none
C) linear
Question
Determine if the type of relation is linear, nonlinear, or none.
A) nonlinear
B) none
C) linear
A) nonlinear
B) none
C) linear
Question
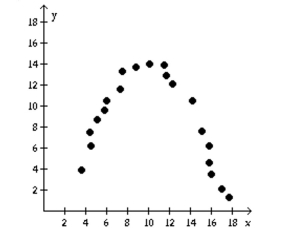
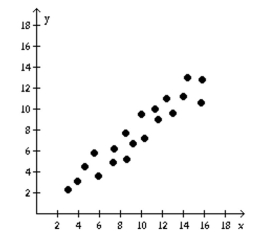
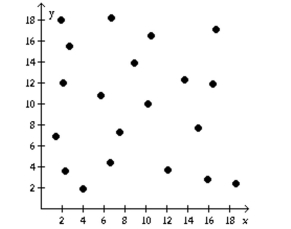
Solve the problem.
-Identify the scatter diagram of the relation that appears linear.
A)
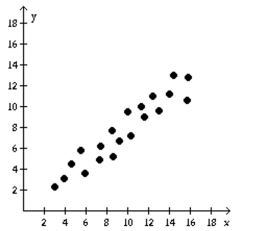
B)
C)
D)
-Identify the scatter diagram of the relation that appears linear.
A)
B)
C)
D)

Unlock Deck
Sign up to unlock the cards in this deck!
Unlock Deck
Unlock Deck
1/301
Play
Full screen (f)
Deck 2: Linear and Quadratic Functions
1
Determine the slope and y-intercept of the function.
F(x) = 1
A) m = 1; b = 0
B) m = 1; b = 1
C) m = 0; b = 0
D) m = 0; b = 1
F(x) = 1
A) m = 1; b = 0
B) m = 1; b = 1
C) m = 0; b = 0
D) m = 0; b = 1
D
2
Determine the slope and y-intercept of the function.
-
A)
B)
C)
D)
-
A)
B)
C)
D)
3
Determine the slope and y-intercept of the function.
h(x) = -2x - 6
A) m = 2; b = 6
B) m = 2; b = - 6
C) m = -2; b = - 6
D) m = -2; b = 6
h(x) = -2x - 6
A) m = 2; b = 6
B) m = 2; b = - 6
C) m = -2; b = - 6
D) m = -2; b = 6
C
4
Use the slope and y-intercept to graph the linear function.
-
A)
B)
C)
D)
-
A)
B)
C)
D)
Unlock Deck
Unlock for access to all 301 flashcards in this deck.
Unlock Deck
k this deck
5
Determine the slope and y-intercept of the function.
-
A)
B)
C)
D)
-
A)
B)
C)
D)
Unlock Deck
Unlock for access to all 301 flashcards in this deck.
Unlock Deck
k this deck
6
Use the slope and y-intercept to graph the linear function.
-
A)
B)
C)
D)
-
A)
B)
C)
D)
Unlock Deck
Unlock for access to all 301 flashcards in this deck.
Unlock Deck
k this deck
7
Determine the average rate of change for the function.
h(x) = -4x + 10
A) 10
B) -10
C) -4
D) 4
h(x) = -4x + 10
A) 10
B) -10
C) -4
D) 4
Unlock Deck
Unlock for access to all 301 flashcards in this deck.
Unlock Deck
k this deck
8
Use the slope and y-intercept to graph the linear function.
-
A)
B)
C)
D)
-
A)
B)
C)
D)
Unlock Deck
Unlock for access to all 301 flashcards in this deck.
Unlock Deck
k this deck
9
Determine the slope and y-intercept of the function.
-
A)
B)
C)
D)
-
A)
B)
C)
D)
Unlock Deck
Unlock for access to all 301 flashcards in this deck.
Unlock Deck
k this deck
10
Determine whether the given function is linear or nonlinear.
-
A) nonlinear
B) linear
-
A) nonlinear
B) linear
Unlock Deck
Unlock for access to all 301 flashcards in this deck.
Unlock Deck
k this deck
11
Use the slope and y-intercept to graph the linear function.
-
A)
B)
C)
D)
-
A)
B)
C)
D)
Unlock Deck
Unlock for access to all 301 flashcards in this deck.
Unlock Deck
k this deck
12
Determine the average rate of change for the function.
-
A)
B) 5
C) 0
D)
-
A)
B) 5
C) 0
D)
Unlock Deck
Unlock for access to all 301 flashcards in this deck.
Unlock Deck
k this deck
13
Use the slope and y-intercept to graph the linear function.
-
A)
B)
C)
D)
-
A)
B)
C)
D)
Unlock Deck
Unlock for access to all 301 flashcards in this deck.
Unlock Deck
k this deck
14
Determine the slope and y-intercept of the function.
f(x) = 2x + 11
A) m = 2; b = -11
B) m = -2; b = 11
C) m = -2; b = -11
D) m = 2; b = 11
f(x) = 2x + 11
A) m = 2; b = -11
B) m = -2; b = 11
C) m = -2; b = -11
D) m = 2; b = 11
Unlock Deck
Unlock for access to all 301 flashcards in this deck.
Unlock Deck
k this deck
15
Determine the slope and y-intercept of the function.
p(x) = -x - 3
A) m =1; b = 3
B) m = -1; b = 3
C) m = 0; b = -3
D) m = -1; b =-3
p(x) = -x - 3
A) m =1; b = 3
B) m = -1; b = 3
C) m = 0; b = -3
D) m = -1; b =-3
Unlock Deck
Unlock for access to all 301 flashcards in this deck.
Unlock Deck
k this deck
16
Use the slope and y-intercept to graph the linear function.
-
A)
B)
C)
D)
-
A)
B)
C)
D)
Unlock Deck
Unlock for access to all 301 flashcards in this deck.
Unlock Deck
k this deck
17
Use the slope and y-intercept to graph the linear function.
-
A)
B)
C)
D)
-
A)
B)
C)
D)
Unlock Deck
Unlock for access to all 301 flashcards in this deck.
Unlock Deck
k this deck
18
Determine the average rate of change for the function.
p(x) = -x + 1
A) - 1
B) -1
C) 1
D) 1
p(x) = -x + 1
A) - 1
B) -1
C) 1
D) 1
Unlock Deck
Unlock for access to all 301 flashcards in this deck.
Unlock Deck
k this deck
19
Determine the average rate of change for the function.
f(x) = 5x - 3
A) 3
B) -5
C) - 3
D) 5
f(x) = 5x - 3
A) 3
B) -5
C) - 3
D) 5
Unlock Deck
Unlock for access to all 301 flashcards in this deck.
Unlock Deck
k this deck
20
Use the slope and y-intercept to graph the linear function.
-
A)
B)
C)
D)
-
A)
B)
C)
D)
Unlock Deck
Unlock for access to all 301 flashcards in this deck.
Unlock Deck
k this deck
21
Find the zero of the linear function.
-
A) 63
B)
C)
D)
-
A) 63
B)
C)
D)
Unlock Deck
Unlock for access to all 301 flashcards in this deck.
Unlock Deck
k this deck
22
Find the zero of the linear function.
g(x) = 6x - 36
A) -36
B) 0
C) 6
D) -6
g(x) = 6x - 36
A) -36
B) 0
C) 6
D) -6
Unlock Deck
Unlock for access to all 301 flashcards in this deck.
Unlock Deck
k this deck
23
Find the zero of the linear function.
f(x) = x + 7
A) 7
B) -7
C) 0
D) 14
f(x) = x + 7
A) 7
B) -7
C) 0
D) 14
Unlock Deck
Unlock for access to all 301 flashcards in this deck.
Unlock Deck
k this deck
24
Graph the function. State whether it is increasing, decreasing, or constant..
-
A) constant
B) constant
C) decreasing
D) constant
-
A) constant
B) constant
C) decreasing
D) constant
Unlock Deck
Unlock for access to all 301 flashcards in this deck.
Unlock Deck
k this deck
25
Find the zero of the linear function.
-
A)
B)
C) 1
D)
-
A)
B)
C) 1
D)
Unlock Deck
Unlock for access to all 301 flashcards in this deck.
Unlock Deck
k this deck
26
Graph the function. State whether it is increasing, decreasing, or constant..
-
A) increasing
B) increasing
C) decreasing
D) increasing
-
A) increasing
B) increasing
C) decreasing
D) increasing
Unlock Deck
Unlock for access to all 301 flashcards in this deck.
Unlock Deck
k this deck
27
Determine the average rate of change for the function.
-
A) 3
B)
C)
D)
-
A) 3
B)
C)
D)
Unlock Deck
Unlock for access to all 301 flashcards in this deck.
Unlock Deck
k this deck
28
Find the zero of the linear function.
-
A)
B)
C) 16
D) 1
-
A)
B)
C) 16
D) 1
Unlock Deck
Unlock for access to all 301 flashcards in this deck.
Unlock Deck
k this deck
29
Determine the average rate of change for the function.
-
A)
B) 3
C)
D)
-
A)
B) 3
C)
D)
Unlock Deck
Unlock for access to all 301 flashcards in this deck.
Unlock Deck
k this deck
30
Graph the function. State whether it is increasing, decreasing, or constant..
-
A) decreasing
B) decreasing
C) increasing
D) decreasing
-
A) decreasing
B) decreasing
C) increasing
D) decreasing
Unlock Deck
Unlock for access to all 301 flashcards in this deck.
Unlock Deck
k this deck
31
Find the zero of the linear function.
f(x) = 6x + 42
A) 42
B) 0
C) 7
D) -7
f(x) = 6x + 42
A) 42
B) 0
C) 7
D) -7
Unlock Deck
Unlock for access to all 301 flashcards in this deck.
Unlock Deck
k this deck
32
Graph the function. State whether it is increasing, decreasing, or constant..
-
A) increasing
B) decreasing
C) increasing
D) decreasing
-
A) increasing
B) decreasing
C) increasing
D) decreasing
Unlock Deck
Unlock for access to all 301 flashcards in this deck.
Unlock Deck
k this deck
33
Graph the function. State whether it is increasing, decreasing, or constant..
-
A) decreasing
B) increasing
C) increasing
D) increasing
-
A) decreasing
B) increasing
C) increasing
D) increasing
Unlock Deck
Unlock for access to all 301 flashcards in this deck.
Unlock Deck
k this deck
34
Graph the function. State whether it is increasing, decreasing, or constant..
-
A) increasing
B) decreasing
C) decreasing
D) increasing
-
A) increasing
B) decreasing
C) decreasing
D) increasing
Unlock Deck
Unlock for access to all 301 flashcards in this deck.
Unlock Deck
k this deck
35
Solve the problem.
-Suppose that and .
(a) Solve .
(b) Solve .
(c) Solve .
A) (a) ; (b) ; (c)
B) ;(b) ;(c)
C) (a) ;(b) ;(c)
D) (a) ;(b) ;(c)
-Suppose that and .
(a) Solve .
(b) Solve .
(c) Solve .
A) (a) ; (b) ; (c)
B) ;(b) ;(c)
C) (a) ;(b) ;(c)
D) (a) ;(b) ;(c)
Unlock Deck
Unlock for access to all 301 flashcards in this deck.
Unlock Deck
k this deck
36
Solve the problem.
-Suppose that and .
(a) Solve .
(b) Solve .
(c) Solve .
A) (a) ;(b) ; (c)
B) ;(b) ;(c)
C) (a) ; (b) ; (c)
D) (a) ;(b) ;(c)
-Suppose that and .
(a) Solve .
(b) Solve .
(c) Solve .
A) (a) ;(b) ; (c)
B) ;(b) ;(c)
C) (a) ; (b) ; (c)
D) (a) ;(b) ;(c)
Unlock Deck
Unlock for access to all 301 flashcards in this deck.
Unlock Deck
k this deck
37
Find the zero of the linear function.
h(x) = 11 - x
A) -22
B) 1
C) 11
D) -11
h(x) = 11 - x
A) -22
B) 1
C) 11
D) -11
Unlock Deck
Unlock for access to all 301 flashcards in this deck.
Unlock Deck
k this deck
38
Find the zero of the linear function.
g(x) = -x + 8
A) 0
B) -8
C) 8
D) -16
g(x) = -x + 8
A) 0
B) -8
C) 8
D) -16
Unlock Deck
Unlock for access to all 301 flashcards in this deck.
Unlock Deck
k this deck
39
Graph the function. State whether it is increasing, decreasing, or constant..
-
A) increasing
B) decreasing
C) increasing
D) decreasing
-
A) increasing
B) decreasing
C) increasing
D) decreasing
Unlock Deck
Unlock for access to all 301 flashcards in this deck.
Unlock Deck
k this deck
40
Graph the function. State whether it is increasing, decreasing, or constant..
-
A) decreasing
B) increasing
C) increasing
D) decreasing
-
A) decreasing
B) increasing
C) increasing
D) decreasing
Unlock Deck
Unlock for access to all 301 flashcards in this deck.
Unlock Deck
k this deck
41
Solve the problem.
The cost for labor associated with fixing a washing machine is computed as follows: There is a fixed charge of $30 for the repairman to come to the house, to which a charge of $23 per hour is added. Find an equation that can be used to determine the labor cost, C(x), of a repair that takes x hours.
A) C(x) = 30 + 23x B) C(x) = 30 - 23x C) C(x) = ( 30 + 23) x D) C(x) = 23 + 30x
Unlock Deck
Unlock for access to all 301 flashcards in this deck.
Unlock Deck
k this deck
42
Solve the problem.
Marty's Tee Shirt & Jacket Company is to produce a new line of jackets with a embroidery of a Great Pyrenees dog on the front. There are fixed costs of $650 to set up for production, and variable costs of $39 per jacket. Write
An equation that can be used to determine the total cost, C(x), encountered by Marty's Company in producing x
Jackets, and use the equation to find the total cost of producing 79 jackets.
A) $3,711
B) $3,723
C) $3,731
D) $3,743
Unlock Deck
Unlock for access to all 301 flashcards in this deck.
Unlock Deck
k this deck
43
Solve the problem.
If an object is dropped from a tower, then the velocity, V (in feet per second), of the object after t seconds can be obtained by multiplying t by 32 and adding 10 to the result. Find V as a linear function of t, and use this
Function to evaluate V(7.4), the velocity of the object at time t = 7.4 seconds.
A) V(7.4) = 244.8 feet per second
B) V(7.4) = 248.1 feet per second
C) V(7.4) = 246.8 feet per second
D) V(7.4) = 246.1 feet per second
Unlock Deck
Unlock for access to all 301 flashcards in this deck.
Unlock Deck
k this deck
44
Plot a scatter diagram.
-
A)
B)
C)
D)
-
A)
B)
C)
D)
Unlock Deck
Unlock for access to all 301 flashcards in this deck.
Unlock Deck
k this deck
45
Solve the problem.
-If an object is dropped off of a tower, the velocity, V, of the object after t seconds can be obtained by multiplying t by 32 and adding 10 to the result. Express V as a linear function of t.
A)
B)
C)
D)
-If an object is dropped off of a tower, the velocity, V, of the object after t seconds can be obtained by multiplying t by 32 and adding 10 to the result. Express V as a linear function of t.
A)
B)
C)
D)
Unlock Deck
Unlock for access to all 301 flashcards in this deck.
Unlock Deck
k this deck
46
Plot a scatter diagram.
-
A)
B)
C)
D)
-
A)
B)
C)
D)
Unlock Deck
Unlock for access to all 301 flashcards in this deck.
Unlock Deck
k this deck
47
Solve the problem.
A lumber yard has fixed costs of $4,726.80 per day and variable costs of $0.1 per board-foot produced. Lumber sells for $1.90 per board-foot. How many board-feet must be produced and sold daily to break even?
A) 2,363 board-feet
B) 47,268 board-feet
C) 1,750 board-feet
D) 2,626 board-feet
A lumber yard has fixed costs of $4,726.80 per day and variable costs of $0.1 per board-foot produced. Lumber sells for $1.90 per board-foot. How many board-feet must be produced and sold daily to break even?
A) 2,363 board-feet
B) 47,268 board-feet
C) 1,750 board-feet
D) 2,626 board-feet
Unlock Deck
Unlock for access to all 301 flashcards in this deck.
Unlock Deck
k this deck
48
Solve the problem.
Let f(x) be the function represented by the dashed line and g(x) be the function represented by the solid line. Solve the equation f(x) = g(x).
A) x = -3
B) x = -1
C) x = 1
D) x = 3
Let f(x) be the function represented by the dashed line and g(x) be the function represented by the solid line. Solve the equation f(x) = g(x).
A) x = -3
B) x = -1
C) x = 1
D) x = 3
Unlock Deck
Unlock for access to all 301 flashcards in this deck.
Unlock Deck
k this deck
49
Solve the problem.
-To convert a temperature from degrees Celsius to degrees Fahrenheit, you multiply the temperature in degrees Celsius by 1.8 and then add 32 to the result. Express F as a linear function of c.
A)
B)
C)
D)
-To convert a temperature from degrees Celsius to degrees Fahrenheit, you multiply the temperature in degrees Celsius by 1.8 and then add 32 to the result. Express F as a linear function of c.
A)
B)
C)
D)
Unlock Deck
Unlock for access to all 301 flashcards in this deck.
Unlock Deck
k this deck
50
Solve the problem.
Marty's Tee Shirt & Jacket Company is to produce a new line of jackets with an embroidery of a Great Pyrenees dog on the front. There are fixed costs of $560 to set up for production, and variable costs of $33 per jacket. Write
An equation that can be used to determine the total cost, C(x), encountered by Marty's Company in producing x
Jackets.
A) C(x) = 560x + 33
B) C(x) = 560 + 33x
C) C(x) = (560 + 33) x
D) C(x) = 560 - 33x
Unlock Deck
Unlock for access to all 301 flashcards in this deck.
Unlock Deck
k this deck
51
Solve the problem.
Regrind, Inc. regrinds used typewriter platens. The variable cost per platen is $1.50. The total cost to regrind 90 platens is $400. Find the linear cost function to regrind platens. If reground platens sell for $8.00 each, how
Many must be reground and sold to break even?
A) C(x) = 1.50x + 400; 62 platens
B) C(x) = 1.50x + 265; 28 platens
C) C(x) = 1.50x + 400; 43 platens
D) C(x) = 1.50x + 265; 41 platens
Unlock Deck
Unlock for access to all 301 flashcards in this deck.
Unlock Deck
k this deck
52
Solve the problem.
A truck rental company rents a moving truck one day by charging $39 plus $0.09 per mile. Write a linear equation that relates the cost C, in dollars, of renting the truck to the number x of miles driven. What is the cost
Of renting the truck if the truck is driven 120 miles?
A) C(x) = 0.09x - 39; -$28.20
B) C(x) = 0.09x + 39; $49.80
C) C(x) = 0.09x + 39; $40.08
D) C(x) = 39x + 0.09; $4,680.09
Unlock Deck
Unlock for access to all 301 flashcards in this deck.
Unlock Deck
k this deck
53
Solve the problem.
Northwest Molded molds plastic handles which cost $0.20 per handle to mold. The fixed cost to run the molding machine is $5,253 per week. If the company sells the handles for $3.20 each, how many handles must
Be molded and sold weekly to break even?
A) 1,167 handles
B) 1,544 handles
C) 26,265 handles
D) 1,751 handles
Unlock Deck
Unlock for access to all 301 flashcards in this deck.
Unlock Deck
k this deck
54
Solve the problem.
In a certain city, the cost of a taxi ride is computed as follows: There is a fixed charge of $2.40 as soon as you get in the taxi, to which a charge of $1.90 per mile is added. Find an equation that can be used to determine the cost, C(x), of an x-mile taxi ride.
A) C(x) = 1.90 + 2.40x B) C(x) = 4.30x C) C(x) = 2.80x D) C(x) = 2.40 + 1.90x
Unlock Deck
Unlock for access to all 301 flashcards in this deck.
Unlock Deck
k this deck
55
Solve the problem.
-Let f(x) be the function represented by the dashed line and g(x) be the function represented by the solid line. Solve the equation f(x)
A)
B)
C)
D)
-Let f(x) be the function represented by the dashed line and g(x) be the function represented by the solid line. Solve the equation f(x)
A)
B)
C)
D)
Unlock Deck
Unlock for access to all 301 flashcards in this deck.
Unlock Deck
k this deck
56
Plot and interpret the appropriate scatter diagram.
-The table gives the times spent watching TV and the grades of several students.
Which scatter diagram describes the data and the relationship, if any?
A)
More hours spent watching TV may reduce grades.
B)
More hours spent watching TV may increase grades.
C)
More hours spent watching TV may reduce grades.
D) none of these
Unlock Deck
Unlock for access to all 301 flashcards in this deck.
Unlock Deck
k this deck
57
Plot and interpret the appropriate scatter diagram.
The table shows the study times and test scores for a number of students. Draw a scatter plot of score versus time
treating time as the independent variable.
The table shows the study times and test scores for a number of students. Draw a scatter plot of score versus time
treating time as the independent variable.
Unlock Deck
Unlock for access to all 301 flashcards in this deck.
Unlock Deck
k this deck
58
Solve the problem.
Let f(x) be the function represented by the dashed line and g(x) be the function represented by the solid line. Solve the equation f(x) < g(x).
A) x < 1
B) x > -2
C) x > 1
D) x < -2
Let f(x) be the function represented by the dashed line and g(x) be the function represented by the solid line. Solve the equation f(x) < g(x).
A) x < 1
B) x > -2
C) x > 1
D) x < -2
Unlock Deck
Unlock for access to all 301 flashcards in this deck.
Unlock Deck
k this deck
59
Solve the problem.
Suppose that the quantity supplied S and quantity demanded D of baseball caps at a major league game are given by the functions S(p) = 5,000 - 100p and D(p) = 150p, where p is the price. Find the equilibrium price for
Caps at the game. Then find the equilibrium quantity.
A) $20, $3,000
B) $33, $1,700
C) $50, $0
D) $50, $3,000
Unlock Deck
Unlock for access to all 301 flashcards in this deck.
Unlock Deck
k this deck
60
Solve the problem.
Linda needs to have her car towed. Little Town Auto charges a flat fee of $75 plus $3 per mile towed. Write a function expressing Linda's towing cost, c, in terms of miles towed, x. Find the cost of having a car towed 3
Miles.
A) c(x) = 3x + 75; $84
B) c(x) = 3x; $78
C) c(x) = 3x + 75; $74
D) c(x) = 3x; $9
Unlock Deck
Unlock for access to all 301 flashcards in this deck.
Unlock Deck
k this deck
61
Solve the problem.
-The following scatter diagram shows heights (in inches) of children and their ages.
Age (years) What is the expected height range for a 2-year old child?
A) 40-50 inches
B) 35-45 inches
C) 25-38 inches
D) 20-30 inches
-The following scatter diagram shows heights (in inches) of children and their ages.
Age (years) What is the expected height range for a 2-year old child?
A) 40-50 inches
B) 35-45 inches
C) 25-38 inches
D) 20-30 inches
Unlock Deck
Unlock for access to all 301 flashcards in this deck.
Unlock Deck
k this deck
62
Determine if the type of relation is linear, nonlinear, or none.
A) none
B) nonlinear
C) linear
A) none
B) nonlinear
C) linear
Unlock Deck
Unlock for access to all 301 flashcards in this deck.
Unlock Deck
k this deck
63
Solve the problem.
-The following scatter diagram shows heights (in inches) of children and their ages.
Age (years) Based on this data, how old do you think a child is who is about 39 inches tall?
A) 3 months
B) 1 year
C) 3 years
D) 7 years
-The following scatter diagram shows heights (in inches) of children and their ages.
Age (years) Based on this data, how old do you think a child is who is about 39 inches tall?
A) 3 months
B) 1 year
C) 3 years
D) 7 years
Unlock Deck
Unlock for access to all 301 flashcards in this deck.
Unlock Deck
k this deck
64
Use a graphing utility to find the equation of the line of best fit. Round to two decimal places, if necessary.
-
A)
B)
C)
D)
-
A)
B)
C)
D)
Unlock Deck
Unlock for access to all 301 flashcards in this deck.
Unlock Deck
k this deck
65
Determine if the type of relation is linear, nonlinear, or none.
A) linear
B) none
C) nonlinear
A) linear
B) none
C) nonlinear
Unlock Deck
Unlock for access to all 301 flashcards in this deck.
Unlock Deck
k this deck
66
Use a graphing utility to find the equation of the line of best fit. Round to two decimal places, if necessary.
-
A)
B)
C)
D)
-
A)
B)
C)
D)
Unlock Deck
Unlock for access to all 301 flashcards in this deck.
Unlock Deck
k this deck
67
Use a graphing utility to find the equation of the line of best fit. Round to two decimal places, if necessary.
-
A)
B)
C)
D)
-
A)
B)
C)
D)
Unlock Deck
Unlock for access to all 301 flashcards in this deck.
Unlock Deck
k this deck
68
Use a graphing utility to find the equation of the line of best fit. Round to two decimal places, if necessary.
-
A)
B)
C)
D)
-
A)
B)
C)
D)
Unlock Deck
Unlock for access to all 301 flashcards in this deck.
Unlock Deck
k this deck
69
Use a graphing utility to find the equation of the line of best fit. Round to two decimal places, if necessary.
-
A)
B)
C)
D)
-
A)
B)
C)
D)
Unlock Deck
Unlock for access to all 301 flashcards in this deck.
Unlock Deck
k this deck
70
Solve the problem.
-The following scatter diagram shows heights (in inches) of children and their ages.
Age (years)
What happens to height as age increases?
A) Height stays the same as age increases.
B) Height and age do not appear to be related.
C) Height increases as age increases.
D) Height decreases as age increases.
Unlock Deck
Unlock for access to all 301 flashcards in this deck.
Unlock Deck
k this deck
71
Plot and interpret the appropriate scatter diagram.
The one-day temperatures for 12 world cities along with their latitudes are shown in the table below. Make a
scatter diagram for the data. Describe what happens to the one-day temperatures as the latitude increases. Latitude (degrees) Temperature (F)°
The one-day temperatures for 12 world cities along with their latitudes are shown in the table below. Make a
scatter diagram for the data. Describe what happens to the one-day temperatures as the latitude increases.
Latitude (degrees) Temperature (F)° Unlock Deck
Unlock for access to all 301 flashcards in this deck.
Unlock Deck
k this deck
72
Use a graphing utility to find the equation of the line of best fit. Round to two decimal places, if necessary.
-
A)
B)
C)
D)
-
A)
B)
C)
D)
Unlock Deck
Unlock for access to all 301 flashcards in this deck.
Unlock Deck
k this deck
73
Use a graphing utility to find the equation of the line of best fit. Round to two decimal places, if necessary.
-
A)
B)
C)
D)
-
A)
B)
C)
D)
Unlock Deck
Unlock for access to all 301 flashcards in this deck.
Unlock Deck
k this deck
74
Determine if the type of relation is linear, nonlinear, or none.
A) none
B) linear
C) nonlinear
A) none
B) linear
C) nonlinear
Unlock Deck
Unlock for access to all 301 flashcards in this deck.
Unlock Deck
k this deck
75
Use a graphing utility to find the equation of the line of best fit. Round to two decimal places, if necessary.
-
A)
B)
C)
D)
-
A)
B)
C)
D)
Unlock Deck
Unlock for access to all 301 flashcards in this deck.
Unlock Deck
k this deck
76
Determine if the type of relation is linear, nonlinear, or none.
A) none
B) linear
C) nonlinear
A) none
B) linear
C) nonlinear
Unlock Deck
Unlock for access to all 301 flashcards in this deck.
Unlock Deck
k this deck
77
Use a graphing utility to find the equation of the line of best fit. Round to two decimal places, if necessary.
-
A)
B)
C)
D)
-
A)
B)
C)
D)
Unlock Deck
Unlock for access to all 301 flashcards in this deck.
Unlock Deck
k this deck
78
Determine if the type of relation is linear, nonlinear, or none.
A) nonlinear
B) none
C) linear
A) nonlinear
B) none
C) linear
Unlock Deck
Unlock for access to all 301 flashcards in this deck.
Unlock Deck
k this deck
79
Determine if the type of relation is linear, nonlinear, or none.
A) nonlinear
B) none
C) linear
A) nonlinear
B) none
C) linear
Unlock Deck
Unlock for access to all 301 flashcards in this deck.
Unlock Deck
k this deck
80
Solve the problem.
-Identify the scatter diagram of the relation that appears linear.
A)
B)
C)
D)
-Identify the scatter diagram of the relation that appears linear.
A)
B)
C)
D)
Unlock Deck
Unlock for access to all 301 flashcards in this deck.
Unlock Deck
k this deck
Unlock Deck
Unlock for access to all 301 flashcards in this deck.


