Deck 16: Additional Topics in Time Series Regression
Full screen (f)
Question
Question
Question
Question
Question
Question
A multiperiod regression forecast h periods into the future based on an AR(p)is computed 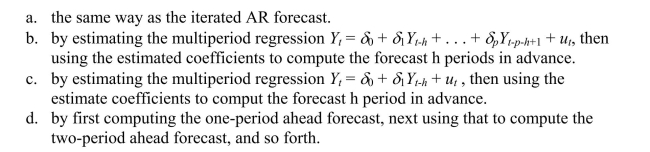
Question
If Yt is I(2), then 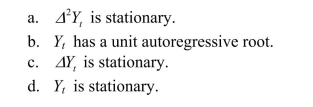
Question
Question
Multiperiod forecasting with multiple predictors 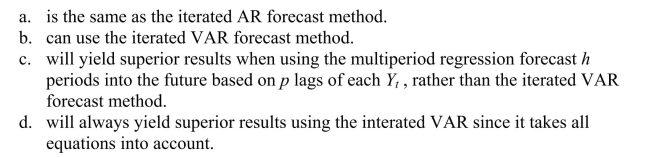
Question
In a VECM, 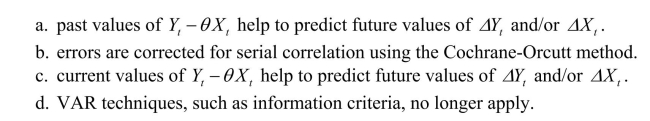
Question
Question
Question
Question
Question
Question
Question
Question
A vector autoregression 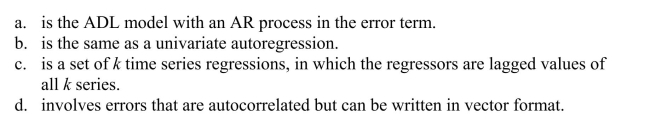
Question
The order of integration 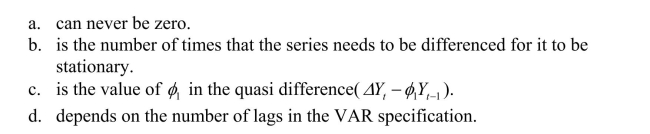
Question
Question
Question
Consider the GARCH (1,1) model 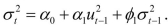 Show that this model can be
rewritten as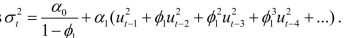 (Hint: use the GARCH(1,1) model but specify it for
  ; substitute this expression into the original specification, and so on.) Explain intuitively the meaning of the resulting formulation.
Show that this model can berewritten as
(Hint: use the GARCH(1,1) model but specify it for ; substitute this expression into the original specification, and so on.) Explain intuitively the meaning of the resulting formulation. Question
Question
Question
Question
Question
Question
Your textbook states that there "are three ways to decide if two variables can plausibly be
modeled as cointegrated: use expert knowledge and economic theory, graph the series
and see whether they appear to have a common stochastic trend, and perform statistical
tests for cointegration.All three ways should be used in practice." Accordingly you set
out to check whether (the log of)consumption and (the log of)personal disposable
income are cointegrated.You collect data for the sample period 1962:I to 1995:IV and
plot the two variables.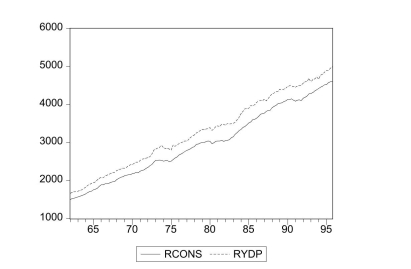 (a)Using the first two methods to examine the series for cointegration, what do you think the
likely answer is?
modeled as cointegrated: use expert knowledge and economic theory, graph the series
and see whether they appear to have a common stochastic trend, and perform statistical
tests for cointegration.All three ways should be used in practice." Accordingly you set
out to check whether (the log of)consumption and (the log of)personal disposable
income are cointegrated.You collect data for the sample period 1962:I to 1995:IV and
plot the two variables.
(a)Using the first two methods to examine the series for cointegration, what do you think thelikely answer is?
Question
Question
Question
Question
There has been much talk recently about the convergence of inflation rates between many
of the OECD economies.You want to see if there is evidence of this closer to home by
checking whether or not Canada's inflation rate and the United States' inflation rate are
cointegrated.
(a)You begin your numerical analysis by testing for a stochastic trend in the variables, using
an Augmented Dickey-Fuller test.The t-statistic for the coefficient of interest is as
follows: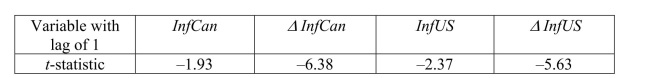 where InfCan is the Canadian inflation rate, and InfUS is the United States inflation rate.
The estimated equation included an intercept.For each case make a decision about the
stationarity of the variables based on the critical value of the Augmented Dickey-Fuller
test statistic.
of the OECD economies.You want to see if there is evidence of this closer to home by
checking whether or not Canada's inflation rate and the United States' inflation rate are
cointegrated.
(a)You begin your numerical analysis by testing for a stochastic trend in the variables, using
an Augmented Dickey-Fuller test.The t-statistic for the coefficient of interest is as
follows:
where InfCan is the Canadian inflation rate, and InfUS is the United States inflation rate.The estimated equation included an intercept.For each case make a decision about the
stationarity of the variables based on the critical value of the Augmented Dickey-Fuller
test statistic.
Question
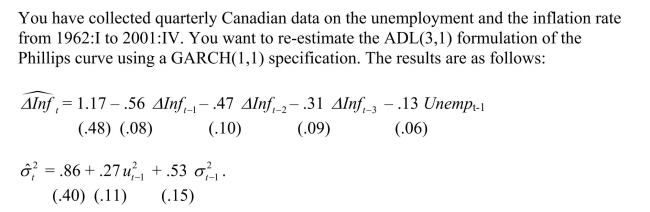
You have collected quarterly data on inflation and unemployment rates for Canada from
1961:III to 1995:IV to estimate a VAR(4)model of the change in the rate of inflation and
the unemployment rate.The results are (a)Explain how you would use the above regressions to conduct one period ahead forecasts.
1961:III to 1995:IV to estimate a VAR(4)model of the change in the rate of inflation and
the unemployment rate.The results are
(a)Explain how you would use the above regressions to conduct one period ahead forecasts. Question
 (a)
(a) 
Question
Question
Consider the following model  is strictly
exogenous. Show that by imposing the restriction you can derive the following so-called Error Correction Mechanism (ECM) model
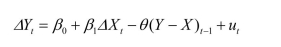
where
What is the short-run (impact) response of a unit increase in X ? What is the long-run solution? Why do you think the term in parenthesis in the above expression is called ECM?
is strictlyexogenous. Show that by imposing the restriction
you can derive the following so-called Error Correction Mechanism (ECM) modelwhere
What is the short-run (impact) response of a unit increase in X ? What is the long-run solution? Why do you think the term in parenthesis in the above expression is called ECM?
Question
Question
Question
Question
 (a)
(a) 

Unlock Deck
Sign up to unlock the cards in this deck!
Unlock Deck
Unlock Deck
1/40
Play
Full screen (f)
Deck 16: Additional Topics in Time Series Regression
1
Unit root tests
A)use the standard normal distribution since they are based on the t-statistic.
B)cannot use the standard normal distribution for statistical inference.As a result the ADF statistic has its own special table of critical values.
C)can use the standard normal distribution only when testing that the level variable is stationary, but not the difference variable.
D)can use the standard normal distribution but only if HAC standard errors were computed.
B
2
The coefficients of the VAR are estimated by
A)using a simultaneous estimation method such as TSLS.
B)maximum likelihood.
C)panel methods.
D)estimating each of the equations by OLS.
A)using a simultaneous estimation method such as TSLS.
B)maximum likelihood.
C)panel methods.
D)estimating each of the equations by OLS.
D
3
A VAR with five variables, 4 lags and constant terms for each equation will have a total of
A)21 coefficients.
B)100 coefficients.
C)105 coefficients.
D)84 coefficients.
A)21 coefficients.
B)100 coefficients.
C)105 coefficients.
D)84 coefficients.
C
4
One advantage of forecasts based on a VAR rather than separately forecasting the variables involved is
A)that VAR forecasts are easier to calculate.
B)you typically have knowledge of future values of at least one of the variables involved.
C)it can help to make the forecasts mutually consistent.
D)that VAR involves panel data.
A)that VAR forecasts are easier to calculate.
B)you typically have knowledge of future values of at least one of the variables involved.
C)it can help to make the forecasts mutually consistent.
D)that VAR involves panel data.
Unlock Deck
Unlock for access to all 40 flashcards in this deck.
Unlock Deck
k this deck
5
A VAR allows you to test joint hypothesis that involve restrictions across multiple equations by
A)computing a z-statistic.
B)computing the BIC but not the AIC.
C)using a stability test.
D)computing an F-statistic.
A)computing a z-statistic.
B)computing the BIC but not the AIC.
C)using a stability test.
D)computing an F-statistic.
Unlock Deck
Unlock for access to all 40 flashcards in this deck.
Unlock Deck
k this deck
6
A multiperiod regression forecast h periods into the future based on an AR(p)is computed
Unlock Deck
Unlock for access to all 40 flashcards in this deck.
Unlock Deck
k this deck
7
If Yt is I(2), then
Unlock Deck
Unlock for access to all 40 flashcards in this deck.
Unlock Deck
k this deck
8
The following is not a consequence of Xt and Yt being cointegrated:
A) if and Yt are both I(1) , then for some
B) have the same stochastic trend.
C) in the expression is called the cointegrating coefficient.
D) if are cointegrated then integrating one of the variables gives you the same result as integrating the other.
A) if and Yt are both I(1) , then for some
B) have the same stochastic trend.
C) in the expression is called the cointegrating coefficient.
D) if are cointegrated then integrating one of the variables gives you the same result as integrating the other.
Unlock Deck
Unlock for access to all 40 flashcards in this deck.
Unlock Deck
k this deck
9
Multiperiod forecasting with multiple predictors
Unlock Deck
Unlock for access to all 40 flashcards in this deck.
Unlock Deck
k this deck
10
In a VECM,
Unlock Deck
Unlock for access to all 40 flashcards in this deck.
Unlock Deck
k this deck
11
You can determine the lag lengths in a VAR
A)by using confidence intervals.
B)by using critical values from the standard normal table.
C)by using either F-tests or information criteria.
D)with the help from economic theory and institutional knowledge.
A)by using confidence intervals.
B)by using critical values from the standard normal table.
C)by using either F-tests or information criteria.
D)with the help from economic theory and institutional knowledge.
Unlock Deck
Unlock for access to all 40 flashcards in this deck.
Unlock Deck
k this deck
12
The biggest conceptual difference between using VARs for forecasting and using them for structural modeling is that
A)you need to use the Granger causality test for structural modeling.
B)structural modeling requires very specific assumptions derived from economic theory and institutional knowledge, of what is exogenous and what is not.
C)you can no longer use the information criteria to decide on the lag length.
D)structural modeling only allows a maximum of three equations in the VAR.
Unlock Deck
Unlock for access to all 40 flashcards in this deck.
Unlock Deck
k this deck
13
The error term in a multiperiod regression
A)is serially correlated.
B)causes OLS to be inconsistent.
C)is serially correlated, but less so the longer the forecast horizon.
D)is serially uncorrelated.
A)is serially correlated.
B)causes OLS to be inconsistent.
C)is serially correlated, but less so the longer the forecast horizon.
D)is serially uncorrelated.
Unlock Deck
Unlock for access to all 40 flashcards in this deck.
Unlock Deck
k this deck
14
To test the null hypothesis of a unit root, the ADF test
A)has higher power than the so-called DF-GLS test.
B)uses complicated interative techniques.
C)cannot be calculated if the variable is integrated of order two or higher.
D)uses a t-statistic and a special critical value.
A)has higher power than the so-called DF-GLS test.
B)uses complicated interative techniques.
C)cannot be calculated if the variable is integrated of order two or higher.
D)uses a t-statistic and a special critical value.
Unlock Deck
Unlock for access to all 40 flashcards in this deck.
Unlock Deck
k this deck
15
The following is not an appropriate way to tell whether two variables are cointegrated
A)see if the two variables are integrated of the same order.
B)graph the series and see whether they appear to have a common stochastic trend.
C)perform statistical tests for cointegration.
D)use expert knowledge and economic theory.
A)see if the two variables are integrated of the same order.
B)graph the series and see whether they appear to have a common stochastic trend.
C)perform statistical tests for cointegration.
D)use expert knowledge and economic theory.
Unlock Deck
Unlock for access to all 40 flashcards in this deck.
Unlock Deck
k this deck
16
If are cointegrated, then the OLS estimator of the coefficient in the cointegrating regression is
A) BLUE
B) unbiased when using HAC standard errors.
C) unbiased even in small samples.
D) consistent.
A) BLUE
B) unbiased when using HAC standard errors.
C) unbiased even in small samples.
D) consistent.
Unlock Deck
Unlock for access to all 40 flashcards in this deck.
Unlock Deck
k this deck
17
Under the VAR assumptions, the OLS estimators are
A)consistent and have a joint normal distribution even in small samples.
B)BLUE.
C)consistent and have a joint normal distribution in large samples.
D)unbiased.
A)consistent and have a joint normal distribution even in small samples.
B)BLUE.
C)consistent and have a joint normal distribution in large samples.
D)unbiased.
Unlock Deck
Unlock for access to all 40 flashcards in this deck.
Unlock Deck
k this deck
18
A vector autoregression
Unlock Deck
Unlock for access to all 40 flashcards in this deck.
Unlock Deck
k this deck
19
The order of integration
Unlock Deck
Unlock for access to all 40 flashcards in this deck.
Unlock Deck
k this deck
20
A)
B)
C)
D)
Unlock Deck
Unlock for access to all 40 flashcards in this deck.
Unlock Deck
k this deck
21
Volatility clustering
A)is evident in most cross-sections.
B)implies that a series is serially correlated.
C)can mostly be found in studies of the labor market.
D)is evident in many financial time series.
A)is evident in most cross-sections.
B)implies that a series is serially correlated.
C)can mostly be found in studies of the labor market.
D)is evident in many financial time series.
Unlock Deck
Unlock for access to all 40 flashcards in this deck.
Unlock Deck
k this deck
22
Consider the GARCH (1,1) model Show that this model can be
rewritten as (Hint: use the GARCH(1,1) model but specify it for ; substitute this expression into the original specification, and so on.) Explain intuitively the meaning of the resulting formulation.
Show that this model can berewritten as
(Hint: use the GARCH(1,1) model but specify it for ; substitute this expression into the original specification, and so on.) Explain intuitively the meaning of the resulting formulation. Unlock Deck
Unlock for access to all 40 flashcards in this deck.
Unlock Deck
k this deck
23
"Heteroskedasticity typically occurs in cross-sections, while serial correlation is typically
observed in time-series data." Discuss and critically evaluate this statement.
observed in time-series data." Discuss and critically evaluate this statement.
Unlock Deck
Unlock for access to all 40 flashcards in this deck.
Unlock Deck
k this deck
24
Carefully explain the difference between forecasting variables separately versus
forecasting a vector of time series variables.Mention how you choose optimal lag lengths
in each case.Part of your essay should deal with multiperiod forecasts and different
methods that can be used in that situation.Finally address the difference between VARS
and VECM.
forecasting a vector of time series variables.Mention how you choose optimal lag lengths
in each case.Part of your essay should deal with multiperiod forecasts and different
methods that can be used in that situation.Finally address the difference between VARS
and VECM.
Unlock Deck
Unlock for access to all 40 flashcards in this deck.
Unlock Deck
k this deck
25
What role does the concept of cointegration and the order of integration play in modeling
the relationship between variables? Explain how tests of cointegration work.
the relationship between variables? Explain how tests of cointegration work.
Unlock Deck
Unlock for access to all 40 flashcards in this deck.
Unlock Deck
k this deck
26
For the United States, there is somewhat conflicting evidence whether or not the inflation
rate has a unit autoregressive root.For example, for the sample period 1962:I to 1999:IV
using the ADF statistic, you cannot reject at the 5% significance level that inflation
contains a stochastic trend.However the null hypothesis can be rejected at the 10%
significance level.The DF-GLS test rejects the null hypothesis at the five percent level.
This result turns out to be sensitive to the number of lags chosen and the sample period.
(a)Somewhat intrigued by these findings, you decide to repeat the exercise using Canadian
data.Letting the AIC choose the lag length of the ADF regression, which turns out to be
three, the ADF statistic is (-1.91).What is your decision regarding the null hypothesis?
Unlock Deck
Unlock for access to all 40 flashcards in this deck.
Unlock Deck
k this deck
27
ARCH and GARCH models are estimated using the
A)OLS estimation method.
B)the method of maximum likelihood.
C)DOLS estimation method.
D)VAR specification.
A)OLS estimation method.
B)the method of maximum likelihood.
C)DOLS estimation method.
D)VAR specification.
Unlock Deck
Unlock for access to all 40 flashcards in this deck.
Unlock Deck
k this deck
28
Your textbook states that there "are three ways to decide if two variables can plausibly be
modeled as cointegrated: use expert knowledge and economic theory, graph the series
and see whether they appear to have a common stochastic trend, and perform statistical
tests for cointegration.All three ways should be used in practice." Accordingly you set
out to check whether (the log of)consumption and (the log of)personal disposable
income are cointegrated.You collect data for the sample period 1962:I to 1995:IV and
plot the two variables. (a)Using the first two methods to examine the series for cointegration, what do you think the
likely answer is?
modeled as cointegrated: use expert knowledge and economic theory, graph the series
and see whether they appear to have a common stochastic trend, and perform statistical
tests for cointegration.All three ways should be used in practice." Accordingly you set
out to check whether (the log of)consumption and (the log of)personal disposable
income are cointegrated.You collect data for the sample period 1962:I to 1995:IV and
plot the two variables.
(a)Using the first two methods to examine the series for cointegration, what do you think thelikely answer is?
Unlock Deck
Unlock for access to all 40 flashcards in this deck.
Unlock Deck
k this deck
29
Some macroeconomic theories suggest that there is a short-run relationship between the
inflation rate and the unemployment rate.How would you go about forecasting these two
variables? Suggest various alternatives and discuss their advantages and disadvantages.
inflation rate and the unemployment rate.How would you go about forecasting these two
variables? Suggest various alternatives and discuss their advantages and disadvantages.
Unlock Deck
Unlock for access to all 40 flashcards in this deck.
Unlock Deck
k this deck
30
Think of at least five examples from economics where theory suggests that the variables
involved are cointegrated.For one of these cases, explain how you would test for
cointegration between the variables involved and how you could use this information to
improve forecasting.
involved are cointegrated.For one of these cases, explain how you would test for
cointegration between the variables involved and how you could use this information to
improve forecasting.
Unlock Deck
Unlock for access to all 40 flashcards in this deck.
Unlock Deck
k this deck
31
You have collected time series for various macroeconomic variables to test if there is a
single cointegrating relationship among multiple variables.Formulate the null hypothesis
and compare the EG-ADF statistic to its critical value.
(a)Canadian unemployment rate, Canadian Inflation Rate, United States unemployment rate,
United States inflation rate; t = (-3.374).
single cointegrating relationship among multiple variables.Formulate the null hypothesis
and compare the EG-ADF statistic to its critical value.
(a)Canadian unemployment rate, Canadian Inflation Rate, United States unemployment rate,
United States inflation rate; t = (-3.374).
Unlock Deck
Unlock for access to all 40 flashcards in this deck.
Unlock Deck
k this deck
32
There has been much talk recently about the convergence of inflation rates between many
of the OECD economies.You want to see if there is evidence of this closer to home by
checking whether or not Canada's inflation rate and the United States' inflation rate are
cointegrated.
(a)You begin your numerical analysis by testing for a stochastic trend in the variables, using
an Augmented Dickey-Fuller test.The t-statistic for the coefficient of interest is as
follows: where InfCan is the Canadian inflation rate, and InfUS is the United States inflation rate.
The estimated equation included an intercept.For each case make a decision about the
stationarity of the variables based on the critical value of the Augmented Dickey-Fuller
test statistic.
of the OECD economies.You want to see if there is evidence of this closer to home by
checking whether or not Canada's inflation rate and the United States' inflation rate are
cointegrated.
(a)You begin your numerical analysis by testing for a stochastic trend in the variables, using
an Augmented Dickey-Fuller test.The t-statistic for the coefficient of interest is as
follows:
where InfCan is the Canadian inflation rate, and InfUS is the United States inflation rate.The estimated equation included an intercept.For each case make a decision about the
stationarity of the variables based on the critical value of the Augmented Dickey-Fuller
test statistic.
Unlock Deck
Unlock for access to all 40 flashcards in this deck.
Unlock Deck
k this deck
33
You have collected quarterly data on inflation and unemployment rates for Canada from
1961:III to 1995:IV to estimate a VAR(4)model of the change in the rate of inflation and
the unemployment rate.The results are (a)Explain how you would use the above regressions to conduct one period ahead forecasts.
1961:III to 1995:IV to estimate a VAR(4)model of the change in the rate of inflation and
the unemployment rate.The results are
(a)Explain how you would use the above regressions to conduct one period ahead forecasts. Unlock Deck
Unlock for access to all 40 flashcards in this deck.
Unlock Deck
k this deck
34
(a) Unlock Deck
Unlock for access to all 40 flashcards in this deck.
Unlock Deck
k this deck
35
Using the ADL (1,1) regression
the ARCH model for the regression error assumes that ut is normally distributed with mean zero and variance where
A)
B)
C)
D)
the ARCH model for the regression error assumes that ut is normally distributed with mean zero and variance where
A)
B)
C)
D)
Unlock Deck
Unlock for access to all 40 flashcards in this deck.
Unlock Deck
k this deck
36
Consider the following model is strictly
exogenous. Show that by imposing the restriction you can derive the following so-called Error Correction Mechanism (ECM) model
where
What is the short-run (impact) response of a unit increase in X ? What is the long-run solution? Why do you think the term in parenthesis in the above expression is called ECM?
is strictlyexogenous. Show that by imposing the restriction
you can derive the following so-called Error Correction Mechanism (ECM) modelwhere
What is the short-run (impact) response of a unit increase in X ? What is the long-run solution? Why do you think the term in parenthesis in the above expression is called ECM?
Unlock Deck
Unlock for access to all 40 flashcards in this deck.
Unlock Deck
k this deck
37
Your textbook so far considered variables for cointegration that are integrated of the
same order.For example, the log of consumption and personal disposable income might
both be I(1)variables, and the error correction term would be I(0), if consumption and
personal disposable income were cointegrated.
(a)Do you think that it makes sense to test for cointegration between two variables if they
are integrated of different orders? Explain.
Unlock Deck
Unlock for access to all 40 flashcards in this deck.
Unlock Deck
k this deck
38
The DOLS estimator has the following property if
are cointegrated:
A) it is BLUE even in small samples.
B) it is efficient in large samples.
C) it has a standard normal distribution when homoskedasticity-only standard errors are used.
D) it has a non-normal distribution in large samples when HAC standard errors are used.
are cointegrated:
A) it is BLUE even in small samples.
B) it is efficient in large samples.
C) it has a standard normal distribution when homoskedasticity-only standard errors are used.
D) it has a non-normal distribution in large samples when HAC standard errors are used.
Unlock Deck
Unlock for access to all 40 flashcards in this deck.
Unlock Deck
k this deck
39
Assume that you have used the OLS estimator in the cointegrating regression and test the residual for a unit root using an ADF test.The resulting ADF test statistic has a
A)normal distribution in large samples.
B)non-normal distribution which require ADF critical values for inference.
C)non-normal distribution which require EG-ADF critical values for inference.
D)normal distribution when HAC standard errors are used.
A)normal distribution in large samples.
B)non-normal distribution which require ADF critical values for inference.
C)non-normal distribution which require EG-ADF critical values for inference.
D)normal distribution when HAC standard errors are used.
Unlock Deck
Unlock for access to all 40 flashcards in this deck.
Unlock Deck
k this deck
40
(a) Unlock Deck
Unlock for access to all 40 flashcards in this deck.
Unlock Deck
k this deck
Unlock Deck
Unlock for access to all 40 flashcards in this deck.


