Deck 20: Income Inequality and Poverty
Full screen (f)
Question
Question
Question
Question
Question
Question
Question
Question
Question
Question
Question
Question
Question
Question
Question
Question
Question
Question
Question
Question
Question
Question
Question
Question
Question
Question
Question
Question
Question
Question
Question
Question
Question
Question
Question
Question
Question
Question
Question
Question
Question
Question
Question
Question
Question
Question
Question
Question
Question
Question
Question
Question
Question
Question
Question
Question
Question
Question
Question
Question
Question
Question
Table 20-13
Distribution of Income in Imagination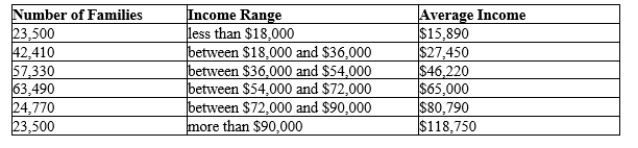
Refer to Table 20-13. The Human Development Report computes a measure of inequality by dividing the income of the richest 10% of the population by the income of the poorest 10%. What is the value for this measure of inequality in Imagination?
Distribution of Income in Imagination
Refer to Table 20-13. The Human Development Report computes a measure of inequality by dividing the income of the richest 10% of the population by the income of the poorest 10%. What is the value for this measure of inequality in Imagination?
Question
Table 20-14
Income Inequality in the United States
The values in the table reflect the percentages of pre-tax-and transfer income.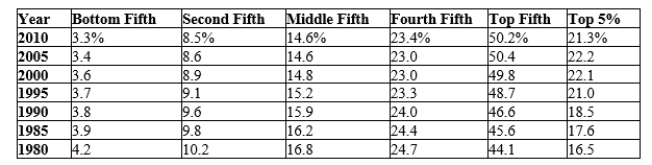 Source: US Census Bureau
Refer to Table 20-14. In percentage terms, how much less income did the bottom 40% of families have in 2010 than in 1980?
Income Inequality in the United States
The values in the table reflect the percentages of pre-tax-and transfer income.
Source: US Census BureauRefer to Table 20-14. In percentage terms, how much less income did the bottom 40% of families have in 2010 than in 1980?
Question
Question
Table 20-14
Income Inequality in the United States
The values in the table reflect the percentages of pre-tax-and transfer income. Source: US Census Bureau
Refer to Table 20-14. In 2010, what percentage of total income in the US did the bottom 20% of families have?
Income Inequality in the United States
The values in the table reflect the percentages of pre-tax-and transfer income.
Source: US Census BureauRefer to Table 20-14. In 2010, what percentage of total income in the US did the bottom 20% of families have?
Question
Table 20-13
Distribution of Income in Imagination
Refer to Table 20-13. If the poverty rate in Imagination is 25%, in what income range on the table is the poverty line?
Distribution of Income in Imagination
Refer to Table 20-13. If the poverty rate in Imagination is 25%, in what income range on the table is the poverty line?
Question
Table 20-14
Income Inequality in the United States
The values in the table reflect the percentages of pre-tax-and transfer income. Source: US Census Bureau
Refer to Table 20-14. In 2010, how many more percentage points of total income did the top fifth of the population earn compared to if the income distribution were completely equal?
Income Inequality in the United States
The values in the table reflect the percentages of pre-tax-and transfer income.
Source: US Census BureauRefer to Table 20-14. In 2010, how many more percentage points of total income did the top fifth of the population earn compared to if the income distribution were completely equal?
Question
Table 20-13
Distribution of Income in Imagination
Refer to Table 20-13. If the poverty line in Imagination is $18,000, what is the poverty rate?
Distribution of Income in Imagination
Refer to Table 20-13. If the poverty line in Imagination is $18,000, what is the poverty rate?
Question
Table 20-14
Income Inequality in the United States
The values in the table reflect the percentages of pre-tax-and transfer income. Source: US Census Bureau
Refer to Table 20-14. If the distribution of income were completely equal, what percentage of income would the bottom fifth of the population earn?
Income Inequality in the United States
The values in the table reflect the percentages of pre-tax-and transfer income.
Source: US Census BureauRefer to Table 20-14. If the distribution of income were completely equal, what percentage of income would the bottom fifth of the population earn?
Question
Table 20-13
Distribution of Income in Imagination
Refer to Table 20-13. The Human Development Report computes a measure of inequality by dividing the income of the richest 10% of the population by the income of the poorest 10%. If the value for this measure of inequality in the US is 15.9 and the value for India is 8.6, how does Imagination compare to these two nations?
Question
Question
Table 20-15
Income Inequality in 2010 in the United States by Race
The values in the table reflect the percentages of pre-tax-and-transfer income.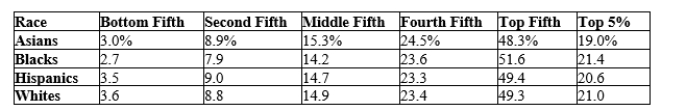 Source: US Census Bureau
Refer to Table 20-15. Which race shows the least equal distribution of income?
Income Inequality in 2010 in the United States by Race
The values in the table reflect the percentages of pre-tax-and-transfer income.
Source: US Census BureauRefer to Table 20-15. Which race shows the least equal distribution of income?
Question
Table 20-15
Income Inequality in 2010 in the United States by Race
The values in the table reflect the percentages of pre-tax-and-transfer income. Source: US Census Bureau
Refer to Table 20-15. In percentage point terms, how much more did the top 5% of the Asian population earn than it would have if income were distributed equally?
Income Inequality in 2010 in the United States by Race
The values in the table reflect the percentages of pre-tax-and-transfer income.
Source: US Census BureauRefer to Table 20-15. In percentage point terms, how much more did the top 5% of the Asian population earn than it would have if income were distributed equally?
Question
Question
Question
Table 20-13
Distribution of Income in Imagination
Refer to Table 20-13. If the poverty rate in Imagination is 10%, what is the poverty line?
Distribution of Income in Imagination
Refer to Table 20-13. If the poverty rate in Imagination is 10%, what is the poverty line?
Question
Question
Table 20-14
Income Inequality in the United States
The values in the table reflect the percentages of pre-tax-and transfer income. Source: US Census Bureau
Refer to Table 20-14. The trend in income inequality from 1980 to 2010 is .
Income Inequality in the United States
The values in the table reflect the percentages of pre-tax-and transfer income.
Source: US Census BureauRefer to Table 20-14. The trend in income inequality from 1980 to 2010 is .
Question
Question

Unlock Deck
Sign up to unlock the cards in this deck!
Unlock Deck
Unlock Deck
1/478
Play
Full screen (f)
Deck 20: Income Inequality and Poverty
1
The United States has more income inequality than Brazil and South Africa.
False
2
The invisible hand of the marketplace acts to allocate resources efficiently, but it does not necessarily ensure that resources are allocated fairly.
True
3
The top 5 percent of U.S. annual family income in 2011 was $205,200 or more.
True
4
The United States has more income inequality than Japan, Germany, and France.
Unlock Deck
Unlock for access to all 478 flashcards in this deck.
Unlock Deck
k this deck
5
The United States has a more equal income distribution than many developing economies such as Mexico, South Africa, and Brazil.
Unlock Deck
Unlock for access to all 478 flashcards in this deck.
Unlock Deck
k this deck
6
When the government enacts policies to make the distribution of income more equitable, it distorts incentives, alters behavior, and makes the allocation of resources less efficient.
Unlock Deck
Unlock for access to all 478 flashcards in this deck.
Unlock Deck
k this deck
7
In the United States from 1935 to 2011 the share of total income earned by the bottom fifth of income earners rose and then fell.
Unlock Deck
Unlock for access to all 478 flashcards in this deck.
Unlock Deck
k this deck
8
An income distribution may not give an accurate picture of the standard of living for the poor because it does not include in-kind transfers.
Unlock Deck
Unlock for access to all 478 flashcards in this deck.
Unlock Deck
k this deck
9
The measured poverty rate may not reflect the true extent of economic deprivation because it does not include some forms of government assistance.
Unlock Deck
Unlock for access to all 478 flashcards in this deck.
Unlock Deck
k this deck
10
In 2011 the top 20% of income earners accounted for over 80% of all income received by United States' families.
Unlock Deck
Unlock for access to all 478 flashcards in this deck.
Unlock Deck
k this deck
11
Despite continued growth in average income since the early 1970s, the poverty rate has not declined below the level reached in 1973.
Unlock Deck
Unlock for access to all 478 flashcards in this deck.
Unlock Deck
k this deck
12
In 2011 the top 5 percent of income earners accounted for over 50% of all income received by United States' families.
Unlock Deck
Unlock for access to all 478 flashcards in this deck.
Unlock Deck
k this deck
13
The poverty line is set by the government so that 10 percent of all families fall below that line and are thereby classified as "poor."
Unlock Deck
Unlock for access to all 478 flashcards in this deck.
Unlock Deck
k this deck
14
Even though the average income in the United States has continued to grow, the poverty rate has increased to over 20% since the early 1970s.
Unlock Deck
Unlock for access to all 478 flashcards in this deck.
Unlock Deck
k this deck
15
In the United States in 2011, the bottom fifth of the income distribution had incomes below $27,218.
Unlock Deck
Unlock for access to all 478 flashcards in this deck.
Unlock Deck
k this deck
16
Among all countries in the world, the United States has the most income inequality.
Unlock Deck
Unlock for access to all 478 flashcards in this deck.
Unlock Deck
k this deck
17
Since 1970 the United States' income distribution has become more equal.
Unlock Deck
Unlock for access to all 478 flashcards in this deck.
Unlock Deck
k this deck
18
The poverty line is an absolute standard and is based on the cost of providing an adequate diet.
Unlock Deck
Unlock for access to all 478 flashcards in this deck.
Unlock Deck
k this deck
19
A U.S. family earning $80,000 would be in the top 20 percent of income distribution in 2011.
Unlock Deck
Unlock for access to all 478 flashcards in this deck.
Unlock Deck
k this deck
20
The United States has a more unequal income distribution than many other developed countries such as Japan and Germany.
Unlock Deck
Unlock for access to all 478 flashcards in this deck.
Unlock Deck
k this deck
21
According to libertarians, the government should redistribute income from rich individuals to poor individuals to achieve a more equal distribution of income.
Unlock Deck
Unlock for access to all 478 flashcards in this deck.
Unlock Deck
k this deck
22
About four out of five millionaires in the United States earned their money rather than inherited it.
Unlock Deck
Unlock for access to all 478 flashcards in this deck.
Unlock Deck
k this deck
23
The elderly represent the largest demographic group in poverty.
Unlock Deck
Unlock for access to all 478 flashcards in this deck.
Unlock Deck
k this deck
24
Utilitarians believe that the proper goal of the government is to maximize the sum of the utilities of everyone in society.
Unlock Deck
Unlock for access to all 478 flashcards in this deck.
Unlock Deck
k this deck
25
The maximin criterion is the idea that the government should aim to maximize the well-being of the worst-off person in society.
Unlock Deck
Unlock for access to all 478 flashcards in this deck.
Unlock Deck
k this deck
26
A follower of liberalism would not support a redistribution of income but rather would focus on equalizing opportunities.
Unlock Deck
Unlock for access to all 478 flashcards in this deck.
Unlock Deck
k this deck
27
The poverty rate is the percentage of the population whose family income falls below the poverty line..
Unlock Deck
Unlock for access to all 478 flashcards in this deck.
Unlock Deck
k this deck
28
About half of black and Hispanic children in female-headed households live in poverty.
Unlock Deck
Unlock for access to all 478 flashcards in this deck.
Unlock Deck
k this deck
29
The economic life cycle describes how young people usually have higher savings rates than middle-aged people.
Unlock Deck
Unlock for access to all 478 flashcards in this deck.
Unlock Deck
k this deck
30
Most economists believe that a family bases its spending decisions on its transitory income.
Unlock Deck
Unlock for access to all 478 flashcards in this deck.
Unlock Deck
k this deck
31
Many economists believe that a family bases its spending decisions on its permanent, or average, income rather than on transitory income.
Unlock Deck
Unlock for access to all 478 flashcards in this deck.
Unlock Deck
k this deck
32
Fewer than three percent of families are poor for eight or more years.
Unlock Deck
Unlock for access to all 478 flashcards in this deck.
Unlock Deck
k this deck
33
There is very little economic mobility in the United States, which means that once a family is poor, it is very likely to remain poor for at least a decade.
Unlock Deck
Unlock for access to all 478 flashcards in this deck.
Unlock Deck
k this deck
34
The poverty line is based on the percentage of people who cannot afford an adequate diet.
Unlock Deck
Unlock for access to all 478 flashcards in this deck.
Unlock Deck
k this deck
35
Standard measurements of the degree of income inequality take both money income and in-kind transfers into account.
Unlock Deck
Unlock for access to all 478 flashcards in this deck.
Unlock Deck
k this deck
36
The poverty rate is an absolute level of income set by the federal government for each family size. A family with income below this rate is deemed to be in poverty.
Unlock Deck
Unlock for access to all 478 flashcards in this deck.
Unlock Deck
k this deck
37
The utilitarian justification for redistributing income is based on the assumption of diminishing marginal utility.
Unlock Deck
Unlock for access to all 478 flashcards in this deck.
Unlock Deck
k this deck
38
According to a study by Michael Cox and Richard Alm, consumption per person in the richest 20% of households was only 2.1 times consumption per person in the poorest 20% of households.
Unlock Deck
Unlock for access to all 478 flashcards in this deck.
Unlock Deck
k this deck
39
If a government could successfully achieve the maximin criterion, each member of society would have an equal income.
Unlock Deck
Unlock for access to all 478 flashcards in this deck.
Unlock Deck
k this deck
40
John Rawls, who developed the way of thinking called liberalism, argued that government policies should be aimed at maximizing the sum of utility of everyone in society.
Unlock Deck
Unlock for access to all 478 flashcards in this deck.
Unlock Deck
k this deck
41
Since 1970, has the distribution of income in the US become more equal, less equal, or remained unchanged?
Unlock Deck
Unlock for access to all 478 flashcards in this deck.
Unlock Deck
k this deck
42
Temporary Assistance for Needy Families (TANF) is an example of a negative income tax program.
Unlock Deck
Unlock for access to all 478 flashcards in this deck.
Unlock Deck
k this deck
43
Scenario 20-8
Suppose the government implemented a negative income tax and used the following formula to compute a family's tax liability:
Taxes owed = (1/4 of income) - $14,000
Refer to Scenario 20-8. A family earning $40,000 before taxes will owe tax.
Suppose the government implemented a negative income tax and used the following formula to compute a family's tax liability:
Taxes owed = (1/4 of income) - $14,000
Refer to Scenario 20-8. A family earning $40,000 before taxes will owe tax.
Unlock Deck
Unlock for access to all 478 flashcards in this deck.
Unlock Deck
k this deck
44
Who said "The inherent vice of capitalism is the unequal sharing of blessings. The inherent virtue of socialism is the equal sharing of miseries"?
Unlock Deck
Unlock for access to all 478 flashcards in this deck.
Unlock Deck
k this deck
45
One existing government program that works much like a negative income tax is the Earned Income Tax Credit.
Unlock Deck
Unlock for access to all 478 flashcards in this deck.
Unlock Deck
k this deck
46
Scenario 20-8
Suppose the government implemented a negative income tax and used the following formula to compute a family's tax liability:
Taxes owed = (1/4 of income) - $14,000
Refer to Scenario 20-8. This negative income tax ensures that families earn at least $56,000.
Suppose the government implemented a negative income tax and used the following formula to compute a family's tax liability:
Taxes owed = (1/4 of income) - $14,000
Refer to Scenario 20-8. This negative income tax ensures that families earn at least $56,000.
Unlock Deck
Unlock for access to all 478 flashcards in this deck.
Unlock Deck
k this deck
47
Critics argue that a disadvantage of the Earned Income Tax Credit is that it does not effectively target the working poor because many recipients are the teenage children of middle-income families.
Unlock Deck
Unlock for access to all 478 flashcards in this deck.
Unlock Deck
k this deck
48
In 2011, the top 20% of US families had more than times as much income as the bottom 20%.
Unlock Deck
Unlock for access to all 478 flashcards in this deck.
Unlock Deck
k this deck
49
A disadvantage of the Earned Income Tax Credit (EITC) program is that it does not help alleviate poverty due to unemployment, sickness, or other inability to work.
Unlock Deck
Unlock for access to all 478 flashcards in this deck.
Unlock Deck
k this deck
50
An advantage of a negative income tax is that it does not encourage the breakup of families because the only criterion for assistance is family income.
Unlock Deck
Unlock for access to all 478 flashcards in this deck.
Unlock Deck
k this deck
51
Approximately what fraction of total income in the US economy comes from labor earnings?
Unlock Deck
Unlock for access to all 478 flashcards in this deck.
Unlock Deck
k this deck
52
Scenario 20-8
Suppose the government implemented a negative income tax and used the following formula to compute a family's tax liability:
Taxes owed = (1/4 of income) - $14,000
Refer to Scenario 20-8. A family earning $56,000 before taxes will have $56,000 after tax.
Suppose the government implemented a negative income tax and used the following formula to compute a family's tax liability:
Taxes owed = (1/4 of income) - $14,000
Refer to Scenario 20-8. A family earning $56,000 before taxes will have $56,000 after tax.
Unlock Deck
Unlock for access to all 478 flashcards in this deck.
Unlock Deck
k this deck
53
One existing government program that works much like a negative income tax is Medicaid.
Unlock Deck
Unlock for access to all 478 flashcards in this deck.
Unlock Deck
k this deck
54
A goal of libertarians is to provide citizens with equal opportunities rather than to ensure equal outcomes.
Unlock Deck
Unlock for access to all 478 flashcards in this deck.
Unlock Deck
k this deck
55
If greater equality is the benefit of government intervention into the allocation of society's resources, what is the cost?
Unlock Deck
Unlock for access to all 478 flashcards in this deck.
Unlock Deck
k this deck
56
Scenario 20-8
Suppose the government implemented a negative income tax and used the following formula to compute a family's tax liability:
Taxes owed = (1/4 of income) - $14,000
Refer to Scenario 20-8. The government does not receive any tax revenue through this negative income tax if the family with the highest income earns $56,000.
Unlock Deck
Unlock for access to all 478 flashcards in this deck.
Unlock Deck
k this deck
57
Libertarians believe that the government should enforce individual rights to ensure that all people have the same opportunities to use their talents to achieve success.
Unlock Deck
Unlock for access to all 478 flashcards in this deck.
Unlock Deck
k this deck
58
The Supplemental Security Income (SSI) program focuses on the poor who are sick or disabled.
Unlock Deck
Unlock for access to all 478 flashcards in this deck.
Unlock Deck
k this deck
59
Critics argue that a disadvantage of minimum-wage laws is that they do not effectively target the working poor because many minimum-wage workers are the teenage children of middle-income families.
Unlock Deck
Unlock for access to all 478 flashcards in this deck.
Unlock Deck
k this deck
60
Scenario 20-8
Suppose the government implemented a negative income tax and used the following formula to compute a family's tax liability:
Taxes owed = (1/4 of income) - $14,000
Refer to Scenario 20-8. The government does not have to pay a subsidy to any family through this negative income tax if the family with the lowest income earns $50,000.
Unlock Deck
Unlock for access to all 478 flashcards in this deck.
Unlock Deck
k this deck
61
What measure does the federal government use when setting the official poverty line in the US?
Unlock Deck
Unlock for access to all 478 flashcards in this deck.
Unlock Deck
k this deck
62
Table 20-13
Distribution of Income in Imagination
Refer to Table 20-13. The Human Development Report computes a measure of inequality by dividing the income of the richest 10% of the population by the income of the poorest 10%. What is the value for this measure of inequality in Imagination?
Distribution of Income in Imagination
Refer to Table 20-13. The Human Development Report computes a measure of inequality by dividing the income of the richest 10% of the population by the income of the poorest 10%. What is the value for this measure of inequality in Imagination?
Unlock Deck
Unlock for access to all 478 flashcards in this deck.
Unlock Deck
k this deck
63
Table 20-14
Income Inequality in the United States
The values in the table reflect the percentages of pre-tax-and transfer income. Source: US Census Bureau
Refer to Table 20-14. In percentage terms, how much less income did the bottom 40% of families have in 2010 than in 1980?
Income Inequality in the United States
The values in the table reflect the percentages of pre-tax-and transfer income.
Source: US Census BureauRefer to Table 20-14. In percentage terms, how much less income did the bottom 40% of families have in 2010 than in 1980?
Unlock Deck
Unlock for access to all 478 flashcards in this deck.
Unlock Deck
k this deck
64
The percentage of the population whose family income falls below an absolute level is call the
Unlock Deck
Unlock for access to all 478 flashcards in this deck.
Unlock Deck
k this deck
65
Table 20-14
Income Inequality in the United States
The values in the table reflect the percentages of pre-tax-and transfer income. Source: US Census Bureau
Refer to Table 20-14. In 2010, what percentage of total income in the US did the bottom 20% of families have?
Income Inequality in the United States
The values in the table reflect the percentages of pre-tax-and transfer income.
Source: US Census BureauRefer to Table 20-14. In 2010, what percentage of total income in the US did the bottom 20% of families have?
Unlock Deck
Unlock for access to all 478 flashcards in this deck.
Unlock Deck
k this deck
66
Table 20-13
Distribution of Income in Imagination
Refer to Table 20-13. If the poverty rate in Imagination is 25%, in what income range on the table is the poverty line?
Distribution of Income in Imagination
Refer to Table 20-13. If the poverty rate in Imagination is 25%, in what income range on the table is the poverty line?
Unlock Deck
Unlock for access to all 478 flashcards in this deck.
Unlock Deck
k this deck
67
Table 20-14
Income Inequality in the United States
The values in the table reflect the percentages of pre-tax-and transfer income. Source: US Census Bureau
Refer to Table 20-14. In 2010, how many more percentage points of total income did the top fifth of the population earn compared to if the income distribution were completely equal?
Income Inequality in the United States
The values in the table reflect the percentages of pre-tax-and transfer income.
Source: US Census BureauRefer to Table 20-14. In 2010, how many more percentage points of total income did the top fifth of the population earn compared to if the income distribution were completely equal?
Unlock Deck
Unlock for access to all 478 flashcards in this deck.
Unlock Deck
k this deck
68
Table 20-13
Distribution of Income in Imagination
Refer to Table 20-13. If the poverty line in Imagination is $18,000, what is the poverty rate?
Distribution of Income in Imagination
Refer to Table 20-13. If the poverty line in Imagination is $18,000, what is the poverty rate?
Unlock Deck
Unlock for access to all 478 flashcards in this deck.
Unlock Deck
k this deck
69
Table 20-14
Income Inequality in the United States
The values in the table reflect the percentages of pre-tax-and transfer income. Source: US Census Bureau
Refer to Table 20-14. If the distribution of income were completely equal, what percentage of income would the bottom fifth of the population earn?
Income Inequality in the United States
The values in the table reflect the percentages of pre-tax-and transfer income.
Source: US Census BureauRefer to Table 20-14. If the distribution of income were completely equal, what percentage of income would the bottom fifth of the population earn?
Unlock Deck
Unlock for access to all 478 flashcards in this deck.
Unlock Deck
k this deck
70
Table 20-13
Distribution of Income in Imagination
Refer to Table 20-13. The Human Development Report computes a measure of inequality by dividing the income of the richest 10% of the population by the income of the poorest 10%. If the value for this measure of inequality in the US is 15.9 and the value for India is 8.6, how does Imagination compare to these two nations?
Unlock Deck
Unlock for access to all 478 flashcards in this deck.
Unlock Deck
k this deck
71
Of the following countries, which has the most equal distribution of income? United States, Brazil, Mexico, China, Japan, Germany, United Kingdom, Russia
Unlock Deck
Unlock for access to all 478 flashcards in this deck.
Unlock Deck
k this deck
72
Table 20-15
Income Inequality in 2010 in the United States by Race
The values in the table reflect the percentages of pre-tax-and-transfer income. Source: US Census Bureau
Refer to Table 20-15. Which race shows the least equal distribution of income?
Income Inequality in 2010 in the United States by Race
The values in the table reflect the percentages of pre-tax-and-transfer income.
Source: US Census BureauRefer to Table 20-15. Which race shows the least equal distribution of income?
Unlock Deck
Unlock for access to all 478 flashcards in this deck.
Unlock Deck
k this deck
73
Table 20-15
Income Inequality in 2010 in the United States by Race
The values in the table reflect the percentages of pre-tax-and-transfer income. Source: US Census Bureau
Refer to Table 20-15. In percentage point terms, how much more did the top 5% of the Asian population earn than it would have if income were distributed equally?
Income Inequality in 2010 in the United States by Race
The values in the table reflect the percentages of pre-tax-and-transfer income.
Source: US Census BureauRefer to Table 20-15. In percentage point terms, how much more did the top 5% of the Asian population earn than it would have if income were distributed equally?
Unlock Deck
Unlock for access to all 478 flashcards in this deck.
Unlock Deck
k this deck
74
With which three demographic variables is poverty correlated?
Unlock Deck
Unlock for access to all 478 flashcards in this deck.
Unlock Deck
k this deck
75
What is the primary problem in comparing income inequality in the US with income inequality in other countries?
Unlock Deck
Unlock for access to all 478 flashcards in this deck.
Unlock Deck
k this deck
76
Table 20-13
Distribution of Income in Imagination
Refer to Table 20-13. If the poverty rate in Imagination is 10%, what is the poverty line?
Distribution of Income in Imagination
Refer to Table 20-13. If the poverty rate in Imagination is 10%, what is the poverty line?
Unlock Deck
Unlock for access to all 478 flashcards in this deck.
Unlock Deck
k this deck
77
The poverty rate is the percentage of the population whose family income falls below an absolute level called the .
Unlock Deck
Unlock for access to all 478 flashcards in this deck.
Unlock Deck
k this deck
78
Table 20-14
Income Inequality in the United States
The values in the table reflect the percentages of pre-tax-and transfer income. Source: US Census Bureau
Refer to Table 20-14. The trend in income inequality from 1980 to 2010 is .
Income Inequality in the United States
The values in the table reflect the percentages of pre-tax-and transfer income.
Source: US Census BureauRefer to Table 20-14. The trend in income inequality from 1980 to 2010 is .
Unlock Deck
Unlock for access to all 478 flashcards in this deck.
Unlock Deck
k this deck
79
Of the following groups, which group is least likely to live in poverty - whites, blacks, Hispanics, Asians?
Unlock Deck
Unlock for access to all 478 flashcards in this deck.
Unlock Deck
k this deck
80
Of the following groups, which group is most likely to live in poverty - children, elderly, married-couple families, female household with no spouse present?
Unlock Deck
Unlock for access to all 478 flashcards in this deck.
Unlock Deck
k this deck
Unlock Deck
Unlock for access to all 478 flashcards in this deck.


