Deck 1: Getting Started
Full screen (f)
Question
Question
Question
Question
Question
Question
Question
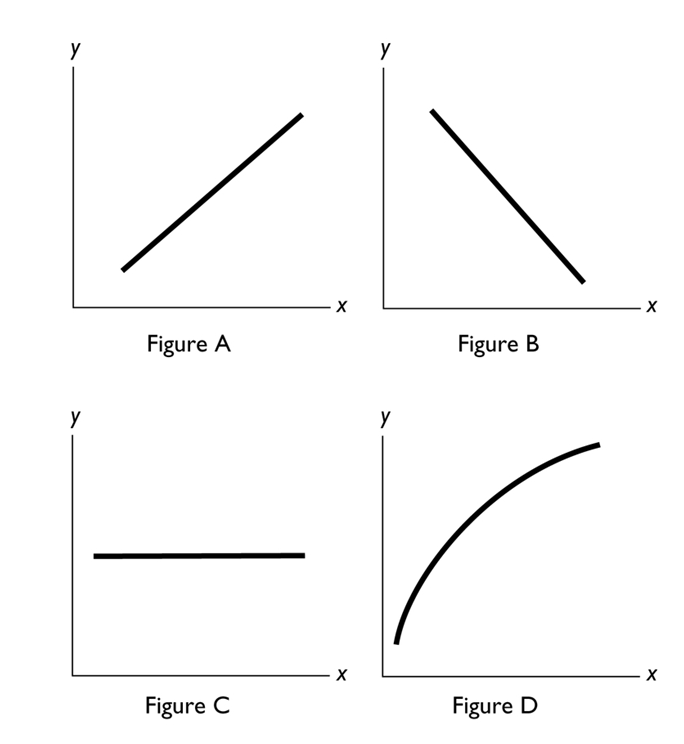
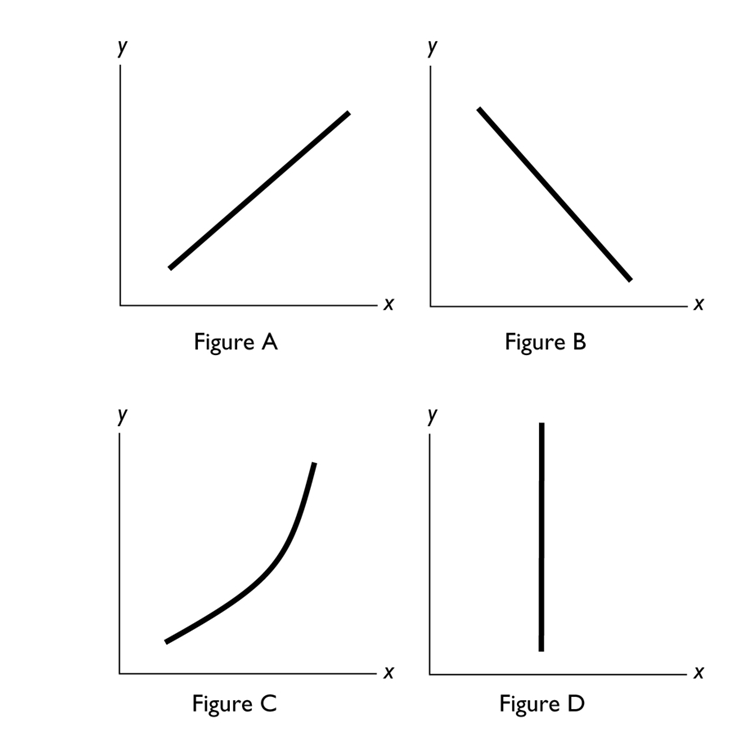
In the above figure, no relationship between x and y is shown in Figure
A)A.
B)B.
C)C.
D)D.
E)A and Figure B.
Question
Question
Question
Question
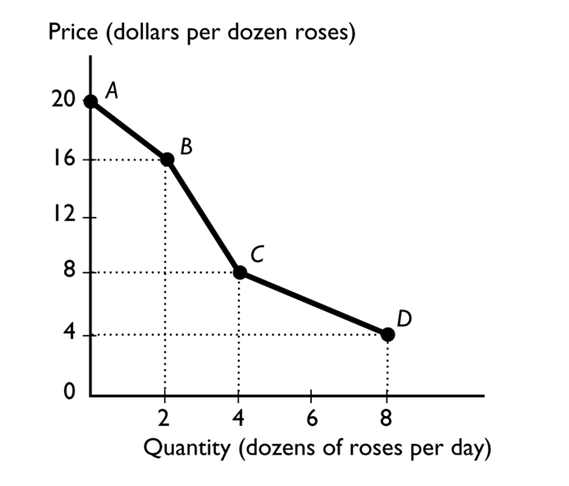
The figure above shows the relationship between the price of a dozen roses and the quantity of roses a florist can sell. The slope between points A and B is
A)2.
B)20.
C)16.
D)4
E)nonexistent because at point A, no roses are sold.
Question
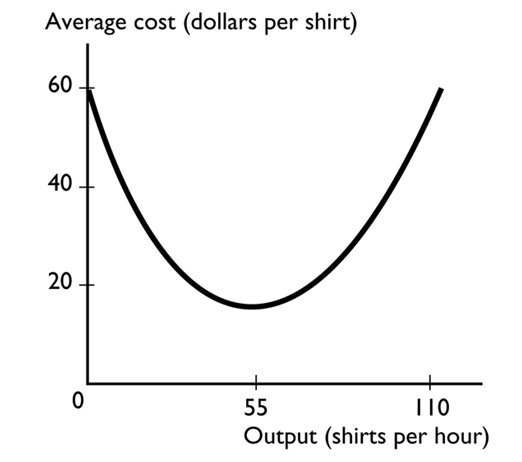
The graph shows
A)a cross-section relationship.
B)a relationship with a maximum.
C)no relationship.
D)a relationship with a minimum.
E)a relationship that becomes less steep.
Question
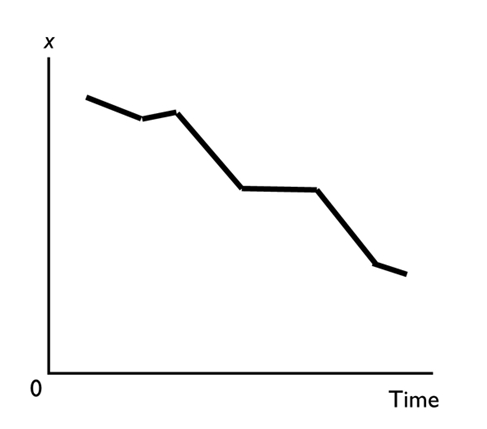
In the above figure, the diagram shows
A)a two-variable scatter diagram.
B)a scatter diagram.
C)a cross-section graph between x and time.
D)a downward trend in x.
E)an upward trend in x.
Question
Question
Question
Question
Question
Question
Question
Question
Question
Question
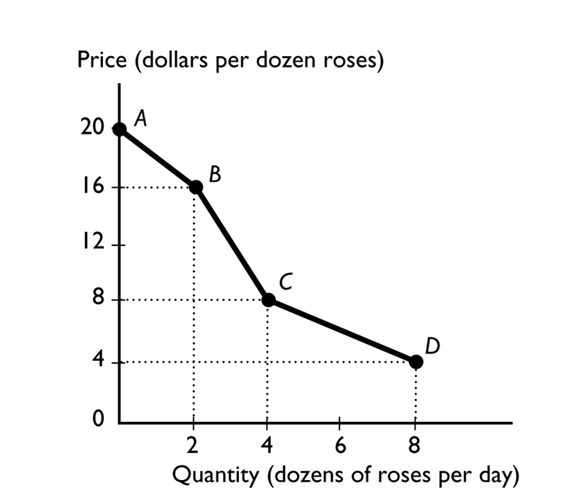
The figure above shows the relationship between the price of a dozen roses and the quantity of roses a florist can sell. The slope between points B and C equals
A)4.
B)8.
C)14.
D)16.
E)2.
Question
Question
Question
Question
Question
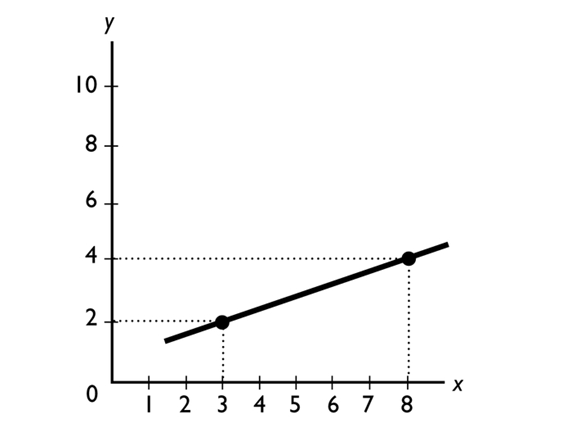
The slope of the line shown in the above figure is
A)5/2.
B)2/5.
C)2/3.
D)5.
E)2.
Question
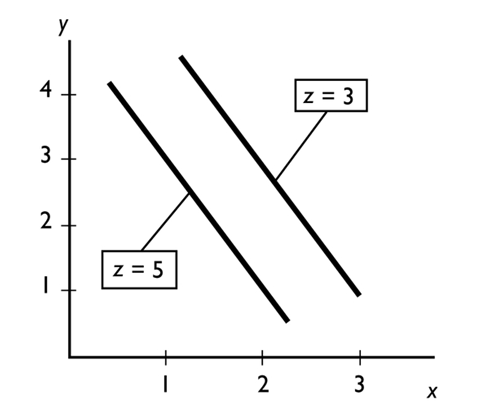
In the figure above, ceteris paribus, an increase in x is associated with
A)no change in either y or z.
B)an increase in y.
C)a decrease in y.
D)an increase in z.
E)a random change in z.
Question
Question
Question
Question
Question
Question
Question
Question
Question
Question
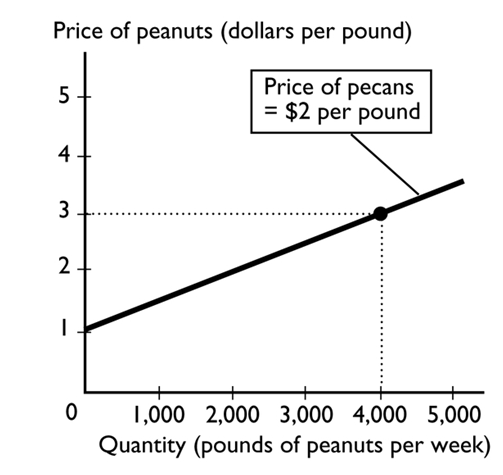
In the above figure, while drawing the line showing the relationship between the price of a pound of peanuts and the quantity sold, the
A)price of a pound of pecans does not change.
B)the quantity of peanuts that farmers supply does not change.
C)price of a pound of peanuts does not change.
D)Both answers A and B are correct.
E)Both answers B and C are correct.
Question
Question
Question
Question
Question
Question
Question
Question
Question
Question
Question
Question
Question
Question
Question
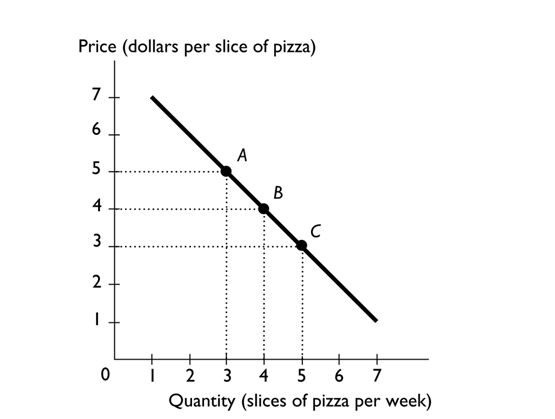
The above figure shows the relationship between the price of a slice of pizza and how many slices of pizza Ricardo buys in a week. Between points A and B, the slope of the line is-------------------- the slope of the line between points B and C.
A)not comparable to
B)greater than
C)unrelated to
D)equal to
E)less than
Question
Question
Question
Question
Question
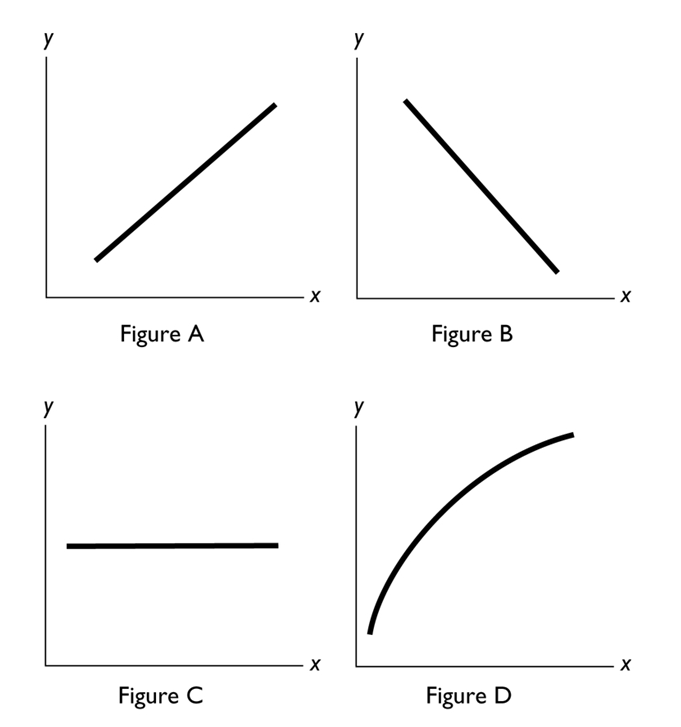
In the above figure, a negative relationship between x and y is shown in Figure
A)A.
B)B.
C)C.
D)D.
E)B and Figure C.
Question
Question
Question
In the above figure, which of the figures shows a relationship between x and y with a negative slope?
A)Figure A
B)Figure B
C)Figure C
D)Figure D
E)Both Figure A and Figure B
Question
Question
The above figure shows the relationship between the price of a slice of pizza and how many slices of pizza Ricardo buys in a week. Between points A and B, the slope of the line equals
A)-4.
B)-3.
C)-2
D)-5.
E)-1.
Question
Question
Question
Question
Question
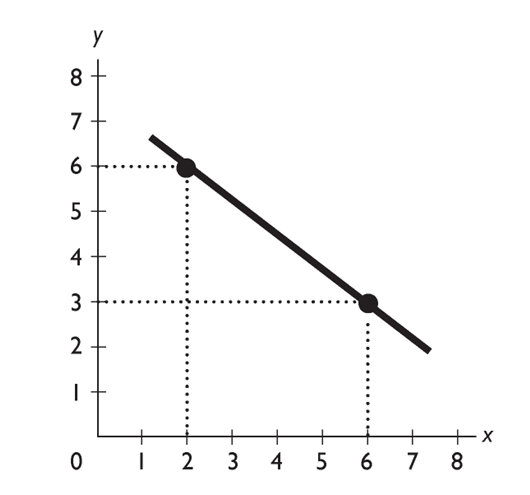
What is the slope of the line in the figure above?
A)1.33
B)0.75
C)Zero
D)-0.75
E)-1.33
Question

In the figure above, an increase in z leads to a
A)leftward shift of the line showing the relationship between x and y.
B)rightward shift of the line showing the relationship between x and y.
C)movement down along one of the lines showing the relationship between x and y.
D)movement up along one of the lines showing the relationship between x and y.
E)trend change in both x and y.
Question
Question
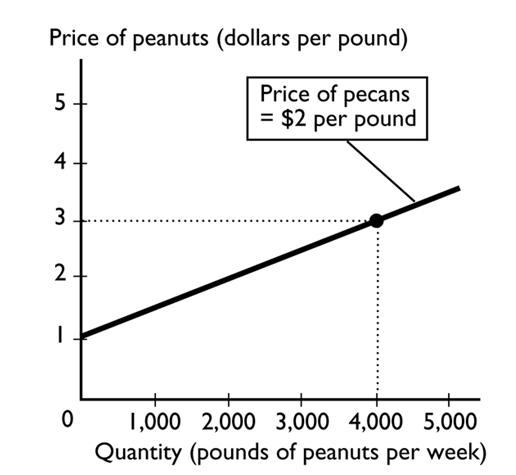
In the figure above, suppose the price of a pound of pecans is negatively related to the quantity of peanuts that farmers are willing to supply. If the price of pecans increases,
A)the curve will shift leftward.
B)the curve will shift rightward.
C)the curve will be unaffected.
D)there is a movement along the curve.
E)None of the above answers is correct because the graph assumes that the price of pecans does not change.
Question
Question
Question
Question
Question
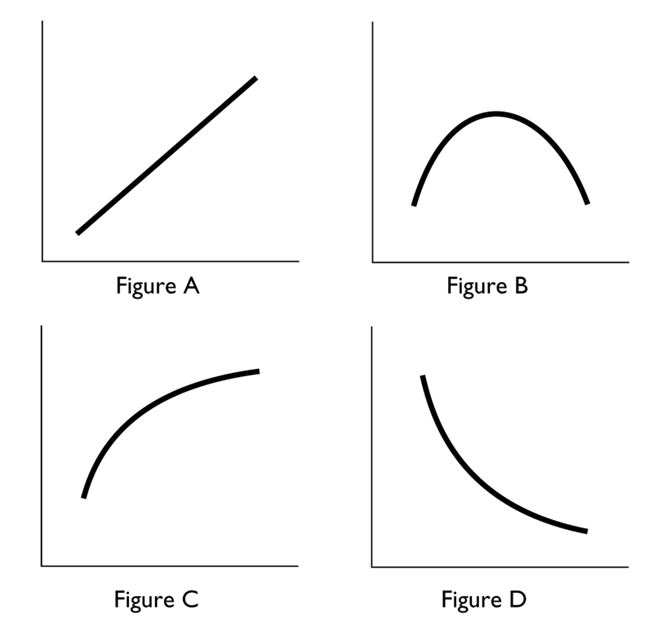
In the above, in which figure(s)is the slope the same at every point?
A)Figures A and C
B)Figure A only
C)Figure B only
D)Figures A, C, and D
E)Figures C and D
Question
In the diagram above, which figure(s)show(s)an inverse relationship between the variables?
A)only D
B)only C
C)both B and C
D)both A and C
E)only B
Question
Question
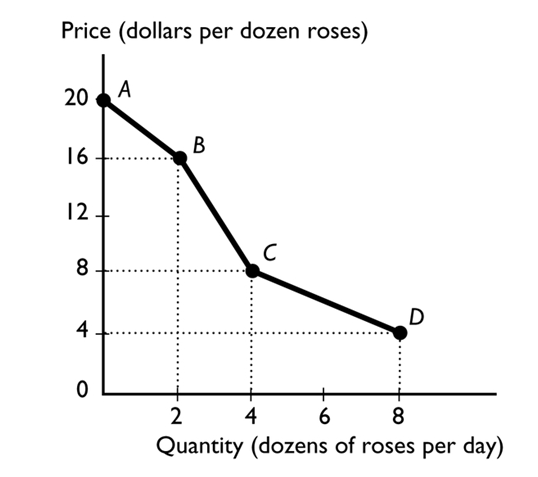
The figure above shows the relationship between the price of a dozen roses and the quantity of roses a florist can sell. The slope between points C and D equals
A)2.
B)4.
C)12
D)8.
E)1.

Unlock Deck
Sign up to unlock the cards in this deck!
Unlock Deck
Unlock Deck
1/200
Play
Full screen (f)
Deck 1: Getting Started
1
A curve with a positive but decreasing slope represents a relationship where, every time the variable measured along the horizontal axis increases by one unit, the variable measured along the vertical axis
A)increases by a constant amount.
B)does not change by much.
C)increases by a decreasing amount.
D)decreases.
E)increases by an increasing amount.
A)increases by a constant amount.
B)does not change by much.
C)increases by a decreasing amount.
D)decreases.
E)increases by an increasing amount.
C
2
A graph shows the price of a pound of cucumbers on the vertical axis and the quantity of new cars sold by Honda on the horizontal axis. The price of a pound of cucumbers remains constant as the quantity of new cars sold increases. The graph of these data is a
A)horizontal line.
B)positively sloped line.
C)negatively sloped line.
D)curve with a maximum.
E)vertical line.
A)horizontal line.
B)positively sloped line.
C)negatively sloped line.
D)curve with a maximum.
E)vertical line.
A
3
A choice made by comparing all relevant alternatives systematically and incrementally is
A)a sunk cost.
B)a choice made in the social interest.
C)an opportunity cost.
D)a choice on the margin.
E)a benefit.
A)a sunk cost.
B)a choice made in the social interest.
C)an opportunity cost.
D)a choice on the margin.
E)a benefit.
D
4
As part of its proposal to win the 2012 Olympics, London developed a carbon offset plan to reduce the Games' impact on the environment. In 2011, the organizers decided to drop this plan to reduce emissions. We can conclude that
A)there are no incentives to reduce carbon emissions.
B)the organizers are not making a rational decision.
C)the organizers are ignoring a sunk cost.
D)it is difficult to calculate the cost of reducing emissions.
E)the marginal cost of reducing emissions exceeded the marginal benefits of reducing emissions.
Unlock Deck
Unlock for access to all 200 flashcards in this deck.
Unlock Deck
k this deck
5
To show the values of an economic variable for different groups in a population at a point in time, it is best to use a
A)trend-section diagram.
B)time-series graph.
C)linear graph.
D)scatter diagram.
E)cross-section graph
A)trend-section diagram.
B)time-series graph.
C)linear graph.
D)scatter diagram.
E)cross-section graph
Unlock Deck
Unlock for access to all 200 flashcards in this deck.
Unlock Deck
k this deck
6
Macroeconomics is the study of
A)national or global economies.
B)how ceteris paribus affects causation.
C)the actions of individual consumers.
D)the government.
E)the actions of individual businesses.
A)national or global economies.
B)how ceteris paribus affects causation.
C)the actions of individual consumers.
D)the government.
E)the actions of individual businesses.
Unlock Deck
Unlock for access to all 200 flashcards in this deck.
Unlock Deck
k this deck
7
In the above figure, no relationship between x and y is shown in Figure
A)A.
B)B.
C)C.
D)D.
E)A and Figure B.
Unlock Deck
Unlock for access to all 200 flashcards in this deck.
Unlock Deck
k this deck
8
A scatter diagram can be used to see
A)the value of a variable for different groups in a population.
B)whether a variable is positively or negatively related to itself.
C)if the value of a variable is rising or falling.
D)how a variable behaves over time.
E)if a relationship exists between two variables.
A)the value of a variable for different groups in a population.
B)whether a variable is positively or negatively related to itself.
C)if the value of a variable is rising or falling.
D)how a variable behaves over time.
E)if a relationship exists between two variables.
Unlock Deck
Unlock for access to all 200 flashcards in this deck.
Unlock Deck
k this deck
9
Of the three major economic questions, which of the following is the best example of a "How?" question?
A)Should we produce more heavy fleece coats?
B)Should we spend more on health care?
C)Should we collect tolls on turnpikes using human toll collectors or mechanized toll machines?
D)Should we eat more oatmeal?
E)Should we build log homes or build factories from bricks?
A)Should we produce more heavy fleece coats?
B)Should we spend more on health care?
C)Should we collect tolls on turnpikes using human toll collectors or mechanized toll machines?
D)Should we eat more oatmeal?
E)Should we build log homes or build factories from bricks?
Unlock Deck
Unlock for access to all 200 flashcards in this deck.
Unlock Deck
k this deck
10
The value of the best thing that a person must give up when making a decision is known as the --------------------cost.
A)direct
B)sunk
C)benefit's
D)explicit
E)opportunity
A)direct
B)sunk
C)benefit's
D)explicit
E)opportunity
Unlock Deck
Unlock for access to all 200 flashcards in this deck.
Unlock Deck
k this deck
11
The figure above shows the relationship between the price of a dozen roses and the quantity of roses a florist can sell. The slope between points A and B is
A)2.
B)20.
C)16.
D)4
E)nonexistent because at point A, no roses are sold.
Unlock Deck
Unlock for access to all 200 flashcards in this deck.
Unlock Deck
k this deck
12
The graph shows
A)a cross-section relationship.
B)a relationship with a maximum.
C)no relationship.
D)a relationship with a minimum.
E)a relationship that becomes less steep.
Unlock Deck
Unlock for access to all 200 flashcards in this deck.
Unlock Deck
k this deck
13
In the above figure, the diagram shows
A)a two-variable scatter diagram.
B)a scatter diagram.
C)a cross-section graph between x and time.
D)a downward trend in x.
E)an upward trend in x.
Unlock Deck
Unlock for access to all 200 flashcards in this deck.
Unlock Deck
k this deck
14
Which type of economic graph reveals trends in data?
A)scatter diagram
B)time-series graph
C)cross-section graph
D)Answers A and C are correct.
E)Answers A, B, and C are all correct.
A)scatter diagram
B)time-series graph
C)cross-section graph
D)Answers A and C are correct.
E)Answers A, B, and C are all correct.
Unlock Deck
Unlock for access to all 200 flashcards in this deck.
Unlock Deck
k this deck
15
Suppose you take a trip during Spring Break. To determine the benefit of taking the trip, you
A)measure what you are willing to give up to take the trip.
B)calculate the opportunity cost of the trip.
C)calculate the value of the next best alternative foregone.
D)must measure what the trip is worth to you and then subtract the cost of the trip.
E)determine the sunk cost of taking the trip.
A)measure what you are willing to give up to take the trip.
B)calculate the opportunity cost of the trip.
C)calculate the value of the next best alternative foregone.
D)must measure what the trip is worth to you and then subtract the cost of the trip.
E)determine the sunk cost of taking the trip.
Unlock Deck
Unlock for access to all 200 flashcards in this deck.
Unlock Deck
k this deck
16
When two variables in a graph are related to a third, changing the third causes
A)a movement along the curve.
B)no change in the curve because the third variable isn't on the axes.
C)a shift of the curve.
D)either a shift or a movement in the curve but more information is needed to determine which occurs.
E)None of the above answers is correct.
A)a movement along the curve.
B)no change in the curve because the third variable isn't on the axes.
C)a shift of the curve.
D)either a shift or a movement in the curve but more information is needed to determine which occurs.
E)None of the above answers is correct.
Unlock Deck
Unlock for access to all 200 flashcards in this deck.
Unlock Deck
k this deck
17
As a person increases his or her caloric intake, the person's weight increases, ceteris paribus. The relationship between the person's caloric intake and the person's weight is an example of
A)a positive relationship.
B)a trended relationship.
C)a single point on a graph.
D)unrelated variables.
E)a negative relationship.
A)a positive relationship.
B)a trended relationship.
C)a single point on a graph.
D)unrelated variables.
E)a negative relationship.
Unlock Deck
Unlock for access to all 200 flashcards in this deck.
Unlock Deck
k this deck
18
Economics is best defined as the social science that studies
A)the way to eliminate choices in our decisions.
B)how a person can get everything he or she wants.
C)the choices that societies, and the people and institutions that make up societies, make in dealing with the issue of scarcity.
D)how choices made in the social interest must conflict with choices made in the self-interest.
E)the reason money exists.
Unlock Deck
Unlock for access to all 200 flashcards in this deck.
Unlock Deck
k this deck
19
Demonstrating how an economic variable changes from one year to the next is best illustrated by a
A)Venn diagram.
B)linear graph.
C)cross-section graph.
D)scatter diagram.
E)time-series graph.
A)Venn diagram.
B)linear graph.
C)cross-section graph.
D)scatter diagram.
E)time-series graph.
Unlock Deck
Unlock for access to all 200 flashcards in this deck.
Unlock Deck
k this deck
20
Mothers Against Drunk Drivers (MADD)campaigned to increase the legal penalties of drunk driving. This successful campaign-------------------- of drunk driving.
A)decreased the marginal cost
B)decreased the marginal benefit
C)increased the marginal cost
D)increased the marginal benefit
E)had no effect on the marginal cost or marginal benefit but did affect the total benefit
A)decreased the marginal cost
B)decreased the marginal benefit
C)increased the marginal cost
D)increased the marginal benefit
E)had no effect on the marginal cost or marginal benefit but did affect the total benefit
Unlock Deck
Unlock for access to all 200 flashcards in this deck.
Unlock Deck
k this deck
21
Which of the following is a macroeconomic issue?
A)The number of jobs and production in Zimbabwe increase.
B)Utilities are required to install more anti-pollution devices.
C)The price of a ticket to Walt Disney World in Orlando is increased.
D)The Iowa corn harvest is smaller than normal.
E)The National Football League signs a new television contract.
Unlock Deck
Unlock for access to all 200 flashcards in this deck.
Unlock Deck
k this deck
22
If the change in y = 10 and the change in x = 3, there is
A)a negative relationship between y and x.
B)a positive relationship between y and x.
C)a +0.33 relationship between the two variables.
D)no relationship between y and x.
E)an independent relationship between y and x.
A)a negative relationship between y and x.
B)a positive relationship between y and x.
C)a +0.33 relationship between the two variables.
D)no relationship between y and x.
E)an independent relationship between y and x.
Unlock Deck
Unlock for access to all 200 flashcards in this deck.
Unlock Deck
k this deck
23
The figure above shows the relationship between the price of a dozen roses and the quantity of roses a florist can sell. The slope between points B and C equals
A)4.
B)8.
C)14.
D)16.
E)2.
Unlock Deck
Unlock for access to all 200 flashcards in this deck.
Unlock Deck
k this deck
24
Making choices on the margin means
A)scribbling on the edges of your notebook paper.
B)comparing all relevant alternatives systematically and incrementally.
C)taking account of all marginal benefits, all opportunity costs, and all sunk costs.
D)making decisions in the largest possible increments.
E)making a decision based on emotions.
Unlock Deck
Unlock for access to all 200 flashcards in this deck.
Unlock Deck
k this deck
25
Choices that are best for the society as a whole are choices in pursuit of
A)the social interest.
B)incentives.
C)answering the "how" question.
D)self interest.
E)answering the "for whom" question.
A)the social interest.
B)incentives.
C)answering the "how" question.
D)self interest.
E)answering the "for whom" question.
Unlock Deck
Unlock for access to all 200 flashcards in this deck.
Unlock Deck
k this deck
26
The marginal cost of an activity --------------------as you do more of it.
A)changes only if the marginal benefit of the activity does not change
B)doesn't change
C)changes only if the marginal benefit of the activity changes
D)increases
E)decreases
A)changes only if the marginal benefit of the activity does not change
B)doesn't change
C)changes only if the marginal benefit of the activity changes
D)increases
E)decreases
Unlock Deck
Unlock for access to all 200 flashcards in this deck.
Unlock Deck
k this deck
27
A time series graph
A)is not useful if the goal is to determine a variable's trend.
B)shows how a certain variable changes over time.
C)uses bars rather than lines.
D)depicts a series of good economic times a nation had.
E)shows points that are scattered.
A)is not useful if the goal is to determine a variable's trend.
B)shows how a certain variable changes over time.
C)uses bars rather than lines.
D)depicts a series of good economic times a nation had.
E)shows points that are scattered.
Unlock Deck
Unlock for access to all 200 flashcards in this deck.
Unlock Deck
k this deck
28
The slope of the line shown in the above figure is
A)5/2.
B)2/5.
C)2/3.
D)5.
E)2.
Unlock Deck
Unlock for access to all 200 flashcards in this deck.
Unlock Deck
k this deck
29
In the figure above, ceteris paribus, an increase in x is associated with
A)no change in either y or z.
B)an increase in y.
C)a decrease in y.
D)an increase in z.
E)a random change in z.
Unlock Deck
Unlock for access to all 200 flashcards in this deck.
Unlock Deck
k this deck
30
If a small change in the x variable results in a large change in the y variable, the curve will be
A)flat.
B)trended.
C)negatively sloped.
D)positively sloped.
E)steep.
A)flat.
B)trended.
C)negatively sloped.
D)positively sloped.
E)steep.
Unlock Deck
Unlock for access to all 200 flashcards in this deck.
Unlock Deck
k this deck
31
Jamie has enough money to buy either a Mountain Dew, or a Pepsi, or a bag of chips. He chooses to buy the Mountain Dew. The opportunity cost of the Mountain Dew is
A)the Pepsi and the bag of chips.
B)zero because he enjoys the Mountain Dew.
C)the Pepsi because it is a drink, as is the Mountain Dew.
D)the Mountain Dew.
E)the Pepsi or the bag of chips, whichever the highest-valued alternative forgone.
A)the Pepsi and the bag of chips.
B)zero because he enjoys the Mountain Dew.
C)the Pepsi because it is a drink, as is the Mountain Dew.
D)the Mountain Dew.
E)the Pepsi or the bag of chips, whichever the highest-valued alternative forgone.
Unlock Deck
Unlock for access to all 200 flashcards in this deck.
Unlock Deck
k this deck
32
To economists, scarcity means that
A)a person looking for work is not able to find work.
B)there can never be answers to the what, how or for whom questions.
C)limited wants cannot be satisfied by the unlimited resources.
D)the number of people without jobs rises when economic times are bad.
E)unlimited wants cannot be satisfied by the limited resources.
Unlock Deck
Unlock for access to all 200 flashcards in this deck.
Unlock Deck
k this deck
33
You have chosen to take a trip during spring break. If you had not gone, you would either have worked at a temporary job or studied for exams. The opportunity cost of your trip is
A)the wages you would have earned from working.
B)the value of the trip.
C)the wages you would have earned from working and the lower grade earned by not studying.
D)the lower grade earned by not studying.
E)We cannot determine what the opportunity cost is without knowing which alternative, working or studying, you would have preferred.
Unlock Deck
Unlock for access to all 200 flashcards in this deck.
Unlock Deck
k this deck
34
Which of the following is true regarding this statement? "The president's decision to spend more money on national defense is smart."
A)This topic would be studied in microeconomics.
B)Ceteris paribus does not apply to the government.
C)The federal government does not face scarcity.
D)This is a normative statement.
E)Social interest must always be more important than self-interest.
A)This topic would be studied in microeconomics.
B)Ceteris paribus does not apply to the government.
C)The federal government does not face scarcity.
D)This is a normative statement.
E)Social interest must always be more important than self-interest.
Unlock Deck
Unlock for access to all 200 flashcards in this deck.
Unlock Deck
k this deck
35
A time-series graph measures
A)time on the x-axis and the variable or variables in which we are interested on the y-axis.
B)the value of one variable against the value of another variable.
C)time on the y-axis and the variable or variables in which we are interested on the x-axis.
D)time on both the x-axis and y-axis and the variable or variables in which we are interested in the rest of the figure.
E)the value of an economic variable for different groups in a population at a point in time.
Unlock Deck
Unlock for access to all 200 flashcards in this deck.
Unlock Deck
k this deck
36
If a curve rises and then falls, it has a
A)constant slope relationship.
B)slope that is negative and then positive.
C)maximum.
D)linear relationship.
E)minimum.
A)constant slope relationship.
B)slope that is negative and then positive.
C)maximum.
D)linear relationship.
E)minimum.
Unlock Deck
Unlock for access to all 200 flashcards in this deck.
Unlock Deck
k this deck
37
When analyzing graphically the relationship between more than two variables, which of the following must be used?
A)assumption of little change
B)positive slope assumption
C)negative slope assumption
D)the assumption that only relevant factors change
E)ceteris paribus
A)assumption of little change
B)positive slope assumption
C)negative slope assumption
D)the assumption that only relevant factors change
E)ceteris paribus
Unlock Deck
Unlock for access to all 200 flashcards in this deck.
Unlock Deck
k this deck
38
Normative statements
I. describe how the world is.
Ii. describe how the world ought to be.
Iii. depend on people's values and cannot be tested.
A)i only.
B)ii only.
C)i and iii.
D)iii only.
E)ii and iii.
I. describe how the world is.
Ii. describe how the world ought to be.
Iii. depend on people's values and cannot be tested.
A)i only.
B)ii only.
C)i and iii.
D)iii only.
E)ii and iii.
Unlock Deck
Unlock for access to all 200 flashcards in this deck.
Unlock Deck
k this deck
39
In the above figure, while drawing the line showing the relationship between the price of a pound of peanuts and the quantity sold, the
A)price of a pound of pecans does not change.
B)the quantity of peanuts that farmers supply does not change.
C)price of a pound of peanuts does not change.
D)Both answers A and B are correct.
E)Both answers B and C are correct.
Unlock Deck
Unlock for access to all 200 flashcards in this deck.
Unlock Deck
k this deck
40
In order to make a rational choice, people must
A)decide quickly without wasting time.
B)compare marginal costs and marginal benefits.
C)determine what is in the social interest.
D)only know what they want.
E)be able to afford the choice decided upon.
A)decide quickly without wasting time.
B)compare marginal costs and marginal benefits.
C)determine what is in the social interest.
D)only know what they want.
E)be able to afford the choice decided upon.
Unlock Deck
Unlock for access to all 200 flashcards in this deck.
Unlock Deck
k this deck
41
Suppose you decide to attend summer school and that this is considered a rational choice. When making this choice,
A)you must ignore the problem of scarcity.
B)you have made a positive statement.
C)you considered the marginal cost and marginal benefit of your choice.
D)you must have considered the social interest.
E)you have used the ceteris paribus assumption.
A)you must ignore the problem of scarcity.
B)you have made a positive statement.
C)you considered the marginal cost and marginal benefit of your choice.
D)you must have considered the social interest.
E)you have used the ceteris paribus assumption.
Unlock Deck
Unlock for access to all 200 flashcards in this deck.
Unlock Deck
k this deck
42
A positive statement
A)might be right or wrong.
B)cannot be negative.
C)cannot be tested.
D)depends on someone's value judgment.
E)must always be right.
A)might be right or wrong.
B)cannot be negative.
C)cannot be tested.
D)depends on someone's value judgment.
E)must always be right.
Unlock Deck
Unlock for access to all 200 flashcards in this deck.
Unlock Deck
k this deck
43
An independent relationship between two variables is shown in a graph by
A)any straight line curve.
B)a downward-sloping line.
C)an upward-sloping line.
D)a steeply sloped line.
E)a horizontal or a vertical line.
A)any straight line curve.
B)a downward-sloping line.
C)an upward-sloping line.
D)a steeply sloped line.
E)a horizontal or a vertical line.
Unlock Deck
Unlock for access to all 200 flashcards in this deck.
Unlock Deck
k this deck
44
A rational choice is one that
A)always turns out for the best for the decision maker.
B)creates no costs for the decision maker.
C)uses the available resources to most effectively satisfy the wants of the person making the choice.
D)must be made with perfect information.
E)is made in the social interest rather than the self-interest.
Unlock Deck
Unlock for access to all 200 flashcards in this deck.
Unlock Deck
k this deck
45
Scarcity exists because
A)some individuals have low income.
B)some people make bad economic decisions.
C)people take too much leisure time.
D)the costs of production are high.
E)human wants exceed the resources available to satisfy them.
A)some individuals have low income.
B)some people make bad economic decisions.
C)people take too much leisure time.
D)the costs of production are high.
E)human wants exceed the resources available to satisfy them.
Unlock Deck
Unlock for access to all 200 flashcards in this deck.
Unlock Deck
k this deck
46
On a graph showing the relationship between x and y, the ceteris paribus condition implies that
A)no other variables are related to x and y.
B)the value of x is held constant.
C)other variables not shown are held constant.
D)the value of x and the value of y are held constant.
E)the value of y is held constant.
A)no other variables are related to x and y.
B)the value of x is held constant.
C)other variables not shown are held constant.
D)the value of x and the value of y are held constant.
E)the value of y is held constant.
Unlock Deck
Unlock for access to all 200 flashcards in this deck.
Unlock Deck
k this deck
47
Most economic graphs have two lines perpendicular to each other. Where these lines meet is called the
A)origin.
B)variable.
C)point of beginning.
D)y-axis.
E)x-axis.
A)origin.
B)variable.
C)point of beginning.
D)y-axis.
E)x-axis.
Unlock Deck
Unlock for access to all 200 flashcards in this deck.
Unlock Deck
k this deck
48
In making your decision whether to take a trip during Spring Break, you compare all the other activities you could undertake. As a result, you
A)limit the cost and the benefits you can gain.
B)are making a choice on the margin.
C)are not making a rational choice.
D)do not face an opportunity cost.
E)must have made a choice in the social interest.
A)limit the cost and the benefits you can gain.
B)are making a choice on the margin.
C)are not making a rational choice.
D)do not face an opportunity cost.
E)must have made a choice in the social interest.
Unlock Deck
Unlock for access to all 200 flashcards in this deck.
Unlock Deck
k this deck
49
When people make rational choices, they
A)weigh the costs and benefits of their options and act to satisfy their wants.
B)are necessarily making the best decision.
C)behave selfishly.
D)do not consider their emotions.
E)necessarily make a decision in the social interest.
A)weigh the costs and benefits of their options and act to satisfy their wants.
B)are necessarily making the best decision.
C)behave selfishly.
D)do not consider their emotions.
E)necessarily make a decision in the social interest.
Unlock Deck
Unlock for access to all 200 flashcards in this deck.
Unlock Deck
k this deck
50
Choices that are best for the individuals that make them are choices in pursuit of
A)efficiency.
B)the social interest.
C)equity.
D)incentives.
E)self interest.
A)efficiency.
B)the social interest.
C)equity.
D)incentives.
E)self interest.
Unlock Deck
Unlock for access to all 200 flashcards in this deck.
Unlock Deck
k this deck
51
When a home builder decides to computerize all of its production schedule, it directly answers the --------------------question.
A)where
B)what
C)how
D)for whom
E)why
A)where
B)what
C)how
D)for whom
E)why
Unlock Deck
Unlock for access to all 200 flashcards in this deck.
Unlock Deck
k this deck
52
The benefit of a one-unit increase in an activity
A)is always greater than the opportunity cost of that activity.
B)is called rational-choice benefit.
C)is called marginal cost.
D)decreases as you do more of it.
E)is measured by what you must give up.
A)is always greater than the opportunity cost of that activity.
B)is called rational-choice benefit.
C)is called marginal cost.
D)decreases as you do more of it.
E)is measured by what you must give up.
Unlock Deck
Unlock for access to all 200 flashcards in this deck.
Unlock Deck
k this deck
53
To show how a variable --------------------, we typically use a-------------------- .
A)changes over time; cross section graph
B)relates to another variable; pie chart
C)changes over time; time series graph
D)relates to another variable; time series graph
E)changes over time; cross time chart
A)changes over time; cross section graph
B)relates to another variable; pie chart
C)changes over time; time series graph
D)relates to another variable; time series graph
E)changes over time; cross time chart
Unlock Deck
Unlock for access to all 200 flashcards in this deck.
Unlock Deck
k this deck
54
The above figure shows the relationship between the price of a slice of pizza and how many slices of pizza Ricardo buys in a week. Between points A and B, the slope of the line is-------------------- the slope of the line between points B and C.
A)not comparable to
B)greater than
C)unrelated to
D)equal to
E)less than
Unlock Deck
Unlock for access to all 200 flashcards in this deck.
Unlock Deck
k this deck
55
Which of the following is true?
I. A rational choice is made on the margin.
Ii. Microeconomics is the study of the national economy while macroeconomics is the study of the global economy.
Iii. Economists try to understand how the economic world works by testing normative statements.
A)i and ii
B)only ii
C)only iii
D)only i
E)i and iii
Unlock Deck
Unlock for access to all 200 flashcards in this deck.
Unlock Deck
k this deck
56
Which of the following is a microeconomic topic?
I)Gas prices increase after a hurricane hits the gulf coast.
Ii)Xavier starts a new business designing web pages.
Iii)Abby decides to practice an extra hour of soccer instead of studying.
A)i and ii
B)ii and iii
C)ii only
D)i, ii and iii
E)i only
I)Gas prices increase after a hurricane hits the gulf coast.
Ii)Xavier starts a new business designing web pages.
Iii)Abby decides to practice an extra hour of soccer instead of studying.
A)i and ii
B)ii and iii
C)ii only
D)i, ii and iii
E)i only
Unlock Deck
Unlock for access to all 200 flashcards in this deck.
Unlock Deck
k this deck
57
When a landscaping company decides to use drafting software and computers instead of hiring designers to draw design plans by hand, it is answering the-------------------- question.
A)opportunity cost
B)why
C)what
D)for whom
E)how
A)opportunity cost
B)why
C)what
D)for whom
E)how
Unlock Deck
Unlock for access to all 200 flashcards in this deck.
Unlock Deck
k this deck
58
The question "Should we produce LCD televisions or computer monitors?" is an example of a--------------------question.
A)what
B)where
C)for whom
D)how
E)why
A)what
B)where
C)for whom
D)how
E)why
Unlock Deck
Unlock for access to all 200 flashcards in this deck.
Unlock Deck
k this deck
59
In the above figure, a negative relationship between x and y is shown in Figure
A)A.
B)B.
C)C.
D)D.
E)B and Figure C.
Unlock Deck
Unlock for access to all 200 flashcards in this deck.
Unlock Deck
k this deck
60
In a graph, a straight line has a negative slope if the line
A)is vertical.
B)is horizontal.
C)rises from left to right.
D)shows a trend.
E)falls from left to right.
A)is vertical.
B)is horizontal.
C)rises from left to right.
D)shows a trend.
E)falls from left to right.
Unlock Deck
Unlock for access to all 200 flashcards in this deck.
Unlock Deck
k this deck
61
An incentive is
A)what you must give up to get something.
B)a good or service that satisfies wants.
C)when people make rational choices by comparing costs and benefits.
D)a reward or a penalty that encourages or discourages an action.
E)a choice is made on the margin.
A)what you must give up to get something.
B)a good or service that satisfies wants.
C)when people make rational choices by comparing costs and benefits.
D)a reward or a penalty that encourages or discourages an action.
E)a choice is made on the margin.
Unlock Deck
Unlock for access to all 200 flashcards in this deck.
Unlock Deck
k this deck
62
In the above figure, which of the figures shows a relationship between x and y with a negative slope?
A)Figure A
B)Figure B
C)Figure C
D)Figure D
E)Both Figure A and Figure B
Unlock Deck
Unlock for access to all 200 flashcards in this deck.
Unlock Deck
k this deck
63
John has two hours of free time this evening. He ranked his alternatives, first go to a concert, second go to a movie, third study for an economics exam, and fourth answer his e-mail. What is the opportunity cost of attending the concert for John?
A)attending a movie, studying for an economics exam, and answering his e-mail
B)studying for an economics exam
C)going to the concert because that is what John choose to do
D)answering his e-mail
E)attending a movie
A)attending a movie, studying for an economics exam, and answering his e-mail
B)studying for an economics exam
C)going to the concert because that is what John choose to do
D)answering his e-mail
E)attending a movie
Unlock Deck
Unlock for access to all 200 flashcards in this deck.
Unlock Deck
k this deck
64
The above figure shows the relationship between the price of a slice of pizza and how many slices of pizza Ricardo buys in a week. Between points A and B, the slope of the line equals
A)-4.
B)-3.
C)-2
D)-5.
E)-1.
Unlock Deck
Unlock for access to all 200 flashcards in this deck.
Unlock Deck
k this deck
65
The additional benefit of increasing some activity by one-unit is called the
A)opportunity cost.
B)scarcity.
C)unit cost/benefit.
D)marginal benefit.
E)total benefit.
A)opportunity cost.
B)scarcity.
C)unit cost/benefit.
D)marginal benefit.
E)total benefit.
Unlock Deck
Unlock for access to all 200 flashcards in this deck.
Unlock Deck
k this deck
66
Proponents of cuts in income tax rates argue that when income tax rates are cut, workers have an incentive to increase their work hours. This argument is based on the assumption that
A)the opportunity cost of working is negative.
B)workers are irrational.
C)workers make decisions based on the social interest.
D)workers make decisions based on the marginal benefit of each hour worked compared to the marginal cost of work.
E)the marginal cost of each additional work hour is not important to most workers.
Unlock Deck
Unlock for access to all 200 flashcards in this deck.
Unlock Deck
k this deck
67
The opportunity cost of a one-unit increase in an activity
A)is measured by what the person is willing to give up to get one more unit of the activity.
B)is called marginal cost.
C)decreases as you do more of it.
D)is greater than the marginal benefit.
E)is called rational cost.
A)is measured by what the person is willing to give up to get one more unit of the activity.
B)is called marginal cost.
C)decreases as you do more of it.
D)is greater than the marginal benefit.
E)is called rational cost.
Unlock Deck
Unlock for access to all 200 flashcards in this deck.
Unlock Deck
k this deck
68
A time series graph reveals whether there is a-------------------- , which represents-------------------- .
A)relationship between two variables; a cross-section relationship
B)trends in two variables; unrelated variables
C)trend in a variable; a general tendency for the variable to rise or fall
D)relationship between two variables; a trend in a variable
E)cross-section relationship; a general tendency for the variables to rise or fall
Unlock Deck
Unlock for access to all 200 flashcards in this deck.
Unlock Deck
k this deck
69
What is the slope of the line in the figure above?
A)1.33
B)0.75
C)Zero
D)-0.75
E)-1.33
Unlock Deck
Unlock for access to all 200 flashcards in this deck.
Unlock Deck
k this deck
70
In the figure above, an increase in z leads to a
A)leftward shift of the line showing the relationship between x and y.
B)rightward shift of the line showing the relationship between x and y.
C)movement down along one of the lines showing the relationship between x and y.
D)movement up along one of the lines showing the relationship between x and y.
E)trend change in both x and y.
Unlock Deck
Unlock for access to all 200 flashcards in this deck.
Unlock Deck
k this deck
71
Whenever one variable increases, another variable decreases. The two variables are
A)definitely related through a third variable.
B)positively related.
C)negatively related.
D)unrelated to each other.
E)related but whether positively or negatively related depends on which variable is plotted on the vertical axis.
A)definitely related through a third variable.
B)positively related.
C)negatively related.
D)unrelated to each other.
E)related but whether positively or negatively related depends on which variable is plotted on the vertical axis.
Unlock Deck
Unlock for access to all 200 flashcards in this deck.
Unlock Deck
k this deck
72
In the figure above, suppose the price of a pound of pecans is negatively related to the quantity of peanuts that farmers are willing to supply. If the price of pecans increases,
A)the curve will shift leftward.
B)the curve will shift rightward.
C)the curve will be unaffected.
D)there is a movement along the curve.
E)None of the above answers is correct because the graph assumes that the price of pecans does not change.
Unlock Deck
Unlock for access to all 200 flashcards in this deck.
Unlock Deck
k this deck
73
The question of "How are goods and services produced?" most closely addresses which of the following issues?
A)Should Ford use expensive industrial robots or inexpensive Mexican autoworkers to produce SUVs?
B)Should Ford build SUVs or luxury cars?
C)Should contractors building residential housing or shopping malls?
D)Why are Christmas trees popular only in December?
E)Is income distributed fairly in the United States?
Unlock Deck
Unlock for access to all 200 flashcards in this deck.
Unlock Deck
k this deck
74
To graph a relationship that involves more than two variables, we use
A)a direct relationship.
B)a positive relationship.
C)a negative relationship.
D)ceteris paribus.
E)movement up along one of the lines showing the relationship between x and y.
A)a direct relationship.
B)a positive relationship.
C)a negative relationship.
D)ceteris paribus.
E)movement up along one of the lines showing the relationship between x and y.
Unlock Deck
Unlock for access to all 200 flashcards in this deck.
Unlock Deck
k this deck
75
Which of the following is a positive statement?
A)Social Security must be reformed.
B)If we reduce welfare payments given to the poor, they will find jobs.
C)Everyone should have some knowledge of economics.
D)The rich should pay more in taxes.
E)Taxes on gasoline should be lower so that gasoline is more affordable to the poor.
A)Social Security must be reformed.
B)If we reduce welfare payments given to the poor, they will find jobs.
C)Everyone should have some knowledge of economics.
D)The rich should pay more in taxes.
E)Taxes on gasoline should be lower so that gasoline is more affordable to the poor.
Unlock Deck
Unlock for access to all 200 flashcards in this deck.
Unlock Deck
k this deck
76
A change in a marginal benefit or cost will
A)increase sunk costs.
B)cause an individual to make a rational choice.
C)increase consumption.
D)change incentives.
E)decrease production.
A)increase sunk costs.
B)cause an individual to make a rational choice.
C)increase consumption.
D)change incentives.
E)decrease production.
Unlock Deck
Unlock for access to all 200 flashcards in this deck.
Unlock Deck
k this deck
77
In the above, in which figure(s)is the slope the same at every point?
A)Figures A and C
B)Figure A only
C)Figure B only
D)Figures A, C, and D
E)Figures C and D
Unlock Deck
Unlock for access to all 200 flashcards in this deck.
Unlock Deck
k this deck
78
In the diagram above, which figure(s)show(s)an inverse relationship between the variables?
A)only D
B)only C
C)both B and C
D)both A and C
E)only B
Unlock Deck
Unlock for access to all 200 flashcards in this deck.
Unlock Deck
k this deck
79
A statement that "All children should receive free health care" is an example of what kind of statement?
A)a positive statement
B)a normative statement
C)a fair statement
D)a statement on the margin
E)a natural experiment statement
A)a positive statement
B)a normative statement
C)a fair statement
D)a statement on the margin
E)a natural experiment statement
Unlock Deck
Unlock for access to all 200 flashcards in this deck.
Unlock Deck
k this deck
80
The figure above shows the relationship between the price of a dozen roses and the quantity of roses a florist can sell. The slope between points C and D equals
A)2.
B)4.
C)12
D)8.
E)1.
Unlock Deck
Unlock for access to all 200 flashcards in this deck.
Unlock Deck
k this deck
Unlock Deck
Unlock for access to all 200 flashcards in this deck.


