Deck 9: Estimation Using a Single Sample
Full screen (f)
Question
Question
Question
Question
Question
Question
Question
Question
Question
The standard error of p is  .
.
. Question
Question
Question
Question
Question
Question
Question
The standard error of  is s.
is s.
is s. Question
Question
Question
Question
Question
One indicator of the health of field mice is the length of their tails. The following data were gathered on a random sample of field mice. A University biologist would like to construct a 95% confidence interval for the population mean tail length of the field mice near Fairfield. (Measures are in mm). 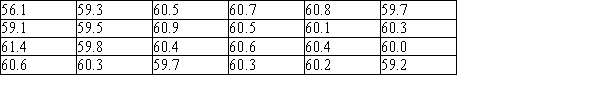
a) Using a graphical display of your choice, display the data in a way that will allow you to determine whether it would be appropriate to use a 95% t confidence interval to estimate the population mean.
b) Using the graphical display from part (a), would you advise that constructing a 95% confidence interval is appropriate? Provide statistical justification for your answer.
Question
Bootstrapping is especially useful when …
A) the sample size that we are working with is small.
B) the sample size that we are working with is large.
C) the sampling distribution of
 is approximately normal.
D) the distribution is symmetric.
A) the sample size that we are working with is small.
B) the sample size that we are working with is large.
C) the sampling distribution of
is approximately normal.D) the distribution is symmetric.
Question
Question
Question
Question
Determine the confidence level associated with the given confidence interval using the standard normal curve. 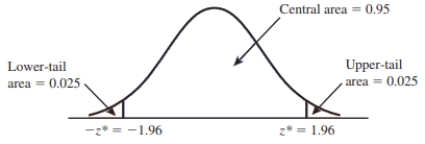
A) 95%
B) 0.05
C) 5%
D) 0.025
E) 1.96
A) 95%
B) 0.05
C) 5%
D) 0.025
E) 1.96
Question
Question
Question
Question
Question
For a 95% confidence level, using the boundaries that capture the middle 95% of the simulated bootstrap distribution is equivalent to determining the endpoints of a confidence interval, which is represented as  minus a number and
  plus a number. For bootstrap confidence intervals, the number subtracted from
  and the number added to
  are the same.
minus a number and plus a number. For bootstrap confidence intervals, the number subtracted from and the number added to are the same. Question
Question
At Abraham Lincoln High School a popular achievement test is used for college placement. Counselors selected a random sample of 100 students from Abraham Lincoln High School and scored their tests by hand before sending them in for computer processing. For this sample,  and s = 25. Construct a 99% confidence interval for μ, the population mean score for Abraham Lincoln High.
and s = 25. Construct a 99% confidence interval for μ, the population mean score for Abraham Lincoln High. Question
Question
Question
Question
Question
Question
Question
The size of the population does need to be considered if sampling is without replacement and the sample size is more than 10% of the population size. In this case, a finite population correction factor  is used to adjust the margin of error (the given margin is multiplied by the correction factor). Since this correction factor is always less than 1, the adjusted margin of error is smaller.
is used to adjust the margin of error (the given margin is multiplied by the correction factor). Since this correction factor is always less than 1, the adjusted margin of error is smaller. Question
For a 95% confidence level, using the boundaries that capture the middle 95% of the bootstrap distribution is equivalent to getting a value for  minus a number, and for
  plus a number. The numbers subtracted and added won't be the same since the bootstrap distribution would not be symmetric.
minus a number, and for plus a number. The numbers subtracted and added won't be the same since the bootstrap distribution would not be symmetric. Question
Question
Would it be appropriate to use a bootstrap confidence interval for the given distribution of a sample mean? 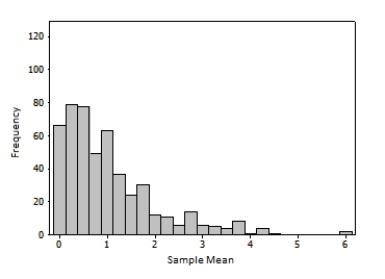
Question
Question
Question

Unlock Deck
Sign up to unlock the cards in this deck!
Unlock Deck
Unlock Deck
1/46
Play
Full screen (f)
Deck 9: Estimation Using a Single Sample
1
The width of the one-sample confidence interval for μ decreases as the sample size grows larger.
True
2
Eyestrain is thought to be associated with different types of office work. The Acme Temp-Help Company provides short-term employees to substitute for vacationing data entry personnel. Previous research has shown that approximately 21% of full time data entry personnel have eyestrain, and Acme would like to estimate the proportion, π, of their 6,000 part-time data entry employees that have eyestrain.
a) They would like to estimate π to within 0.05 with 95% confidence. If they accept the starting value of 0.21 as a reasonable initial estimate of π, what sample size should they use for their study?
b) Suppose Acme had felt that the working conditions of their temporary data entry personnel were different enough that they should not depend on the 0.21 as an initial estimate. In a few sentences, explain how your procedure for choosing a samples size would differ from your solution in part (a). (Do NOT recalculate a new estimate of the necessary sample size!)
a) 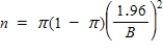
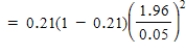 = 254.93 Thus, a sample of at least 255 will be needed.
b) If no prior estimate of the population proportion is available, using p = 0.50 in the formula for n above would provide a sufficient sample size.
= 254.93 Thus, a sample of at least 255 will be needed. b) If no prior estimate of the population proportion is available, using p = 0.50 in the formula for n above would provide a sufficient sample size.
3
Conventional home smoke alarms have too often failed to awaken sleeping children--they are remarkably resistant to being awakened by sound, even in the daytime! Researchers are studying the possibility that a personalized "voice" smoke alarm would be more effective than mere sound. The idea is that a recording of the mother's voice calling the child's name may be an improvement over existing systems.
a) The researchers would like to estimate π to within 0.05 with 95% confidence. Past experience has shown that conventional alarms are effective about 0.58 of the time. If this is accepted as a reasonable initial estimate of π, what sample size should they use for their study?
b) Suppose the researchers felt that the original study, done with children of parents working in a single hospital, was different enough so that their results (p = 0.58) should not be relied upon. In a few sentences, explain how your procedure for choosing a samples size would differ from your solution in part (a). (Do NOT recalculate a new estimate of the necessary sample size!)
a) 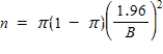
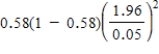 = 374.3255 Thus, a sample of at least 375 children will be needed.
b) If no price estimate of the population proportion is available, using p = 0.50 in the formula for n above would provide a sufficient sample size.
= 374.3255 Thus, a sample of at least 375 children will be needed. b) If no price estimate of the population proportion is available, using p = 0.50 in the formula for n above would provide a sufficient sample size.
4
All else being equal, the higher the confidence level, the wider the confidence interval.
Unlock Deck
Unlock for access to all 46 flashcards in this deck.
Unlock Deck
k this deck
5
Under what conditions is it reasonable to use the t confidence interval to estimate a population mean?
Unlock Deck
Unlock for access to all 46 flashcards in this deck.
Unlock Deck
k this deck
6
An understanding of bird's choices of habitat is a crucial element in understanding avian biology and ecology. One aspect of habitat choice is the pattern of their preferred vertical height when feeding in forests. In a study of small birds in an old-growth forest in the Pacific Northwest, researchers (suspended from a giant crane!) observed the landings of Golden-crowned kinglets (Regulus strapa). They found that 78 of the 163 landings were in the "mid" height region, 21-40 meters above ground.
a) Compute a point estimate of the population proportion of all landings of these kinglets that are in the 21 - 40 meter height range.
b) Construct and interpret a 95% confidence interval for π, the population proportion of all landings of these kinglets that are in the 21 - 40 meter height range.
a) Compute a point estimate of the population proportion of all landings of these kinglets that are in the 21 - 40 meter height range.
b) Construct and interpret a 95% confidence interval for π, the population proportion of all landings of these kinglets that are in the 21 - 40 meter height range.
Unlock Deck
Unlock for access to all 46 flashcards in this deck.
Unlock Deck
k this deck
7
Since s2 gives an unbiased estimate of σ2, s gives an unbiased estimate of σ.
Unlock Deck
Unlock for access to all 46 flashcards in this deck.
Unlock Deck
k this deck
8
In a study of termite populations in Swaziland, the following data were gathered on the percentage of termites that were classified as "major workers" at eight randomly selected sites: 37.6 20.0 28.8 29.9 51.9 13.6 34.5 29.0
a) Use the given data to produce a point estimate of μ, the true mean percentage of termites that are "major workers."
b) Use the given data to produce an unbiased point estimate of σ2, the population variance of the percentage of termites that are "major workers."
a) Use the given data to produce a point estimate of μ, the true mean percentage of termites that are "major workers."
b) Use the given data to produce an unbiased point estimate of σ2, the population variance of the percentage of termites that are "major workers."
Unlock Deck
Unlock for access to all 46 flashcards in this deck.
Unlock Deck
k this deck
9
The standard error of p is .
. Unlock Deck
Unlock for access to all 46 flashcards in this deck.
Unlock Deck
k this deck
10
Under what conditions is it reasonable to use the z confidence interval to estimate a population mean?
Unlock Deck
Unlock for access to all 46 flashcards in this deck.
Unlock Deck
k this deck
11
Using an unbiased statistic guarantees that there will be no systematic tendency to under- or overestimate the value of the population characteristic and that estimates will almost always be relatively close to the true value.
Unlock Deck
Unlock for access to all 46 flashcards in this deck.
Unlock Deck
k this deck
12
The confidence interval formula for estimating μ, that is used when n is large, is based on the Central Limit Theorem.
Unlock Deck
Unlock for access to all 46 flashcards in this deck.
Unlock Deck
k this deck
13
If the distribution of a population is symmetric, both the mean and median give unbiased estimates of the population mean. What criteria would you consider in choosing which statistic to use if you wanted to estimate the population mean?
Unlock Deck
Unlock for access to all 46 flashcards in this deck.
Unlock Deck
k this deck
14
The large sample confidence interval formula for estimating π can always safely be used if n ≥ 30.
Unlock Deck
Unlock for access to all 46 flashcards in this deck.
Unlock Deck
k this deck
15
A t curve is bell-shaped like the z curve but is less spread out.
Unlock Deck
Unlock for access to all 46 flashcards in this deck.
Unlock Deck
k this deck
16
The standard error of is s.
is s. Unlock Deck
Unlock for access to all 46 flashcards in this deck.
Unlock Deck
k this deck
17
A recent study investigated the effects of a "Buckle Up Your Toddlers" campaign to get parents to use the grocery cart seat belts. Investigators observed a simple random sample of parents in a large city, and found 192 out of 594 parents buckling up their toddlers.
a) Compute a point estimate of the true proportion of all parents who buckle up their toddlers.
b) Construct and interpret a 95% confidence interval for π, the true proportion of all parents who buckle up their toddlers.
a) Compute a point estimate of the true proportion of all parents who buckle up their toddlers.
b) Construct and interpret a 95% confidence interval for π, the true proportion of all parents who buckle up their toddlers.
Unlock Deck
Unlock for access to all 46 flashcards in this deck.
Unlock Deck
k this deck
18
What is the difference between an unbiased statistic and a biased statistic?
Unlock Deck
Unlock for access to all 46 flashcards in this deck.
Unlock Deck
k this deck
19
The t confidence interval formula for estimating μ should only be used when the population being sampled is at least approximately normally distributed.
Unlock Deck
Unlock for access to all 46 flashcards in this deck.
Unlock Deck
k this deck
20
Bicycle crashes are a common cause of severe injuries in childhood. A researcher theorized that this might be because of inadequate "gap" time (the time between a bicycling child clearing an intersection and the subsequent entry of an oncoming car into that intersection). A researcher experimentally investigated the gap judgments of 10-year-olds by placing them in a computer-generated virtual environment of cars approaching an intersection at 25 mph. The following gap times were observed for ten randomly selected children: 6.72, 4.18, 2.32, 4.05, 8.39, 5.44, 6.24, 2.05, 3.29, 5.38
a) Use the given data to produce a point estimate of μ, the population mean gap time of 10-year-olds from this population.
b) Use the given data to produce an unbiased point estimate of σ2, the population variance of the gap time of 10-year-olds from this population.
a) Use the given data to produce a point estimate of μ, the population mean gap time of 10-year-olds from this population.
b) Use the given data to produce an unbiased point estimate of σ2, the population variance of the gap time of 10-year-olds from this population.
Unlock Deck
Unlock for access to all 46 flashcards in this deck.
Unlock Deck
k this deck
21
One indicator of the health of field mice is the length of their tails. The following data were gathered on a random sample of field mice. A University biologist would like to construct a 95% confidence interval for the population mean tail length of the field mice near Fairfield. (Measures are in mm).
a) Using a graphical display of your choice, display the data in a way that will allow you to determine whether it would be appropriate to use a 95% t confidence interval to estimate the population mean.
b) Using the graphical display from part (a), would you advise that constructing a 95% confidence interval is appropriate? Provide statistical justification for your answer.
Unlock Deck
Unlock for access to all 46 flashcards in this deck.
Unlock Deck
k this deck
22
Bootstrapping is especially useful when …
A) the sample size that we are working with is small.
B) the sample size that we are working with is large.
C) the sampling distribution of
is approximately normal.
D) the distribution is symmetric.
A) the sample size that we are working with is small.
B) the sample size that we are working with is large.
C) the sampling distribution of
is approximately normal.D) the distribution is symmetric.
Unlock Deck
Unlock for access to all 46 flashcards in this deck.
Unlock Deck
k this deck
23
The conclusion "We can be 95% confident that between 68% and 85% of people in this town prefer e-books to paper books" is the interpretation of
A) confidence interval
B) confidence level
C) margin error
D) standard error
A) confidence interval
B) confidence level
C) margin error
D) standard error
Unlock Deck
Unlock for access to all 46 flashcards in this deck.
Unlock Deck
k this deck
24
One difficulty in measuring the nesting success of birds is that the researchers must count the eggs in the nest, which is disturbing to the parents. Even though the researcher does not harm the birds, the flight of the bird might alert predators to the presence of a nest. To see if researcher activity might degrade nesting success, the nest survival of 102 nests that had their eggs counted, was recorded. Sixty-four of the nests failed (i.e. the parent abandoned the nest).
a) Construct and interpret a 95% confidence interval for the proportion of nest failures in the population.
b) The "normal" nest failure rate of these birds is 29%. Based on the confidence interval from part (a), do you think that the researcher's activity affects nesting success? Justify your answer with an appropriate statistical argument.
Unlock Deck
Unlock for access to all 46 flashcards in this deck.
Unlock Deck
k this deck
25
When choosing a statistic for computing an estimate, what factors should be considered?
Unlock Deck
Unlock for access to all 46 flashcards in this deck.
Unlock Deck
k this deck
26
Determine the confidence level associated with the given confidence interval using the standard normal curve.
A) 95%
B) 0.05
C) 5%
D) 0.025
E) 1.96
A) 95%
B) 0.05
C) 5%
D) 0.025
E) 1.96
Unlock Deck
Unlock for access to all 46 flashcards in this deck.
Unlock Deck
k this deck
27
A new species of sea crab has been discovered, and an experiment conducted to determine whether or not the animal can regulate its temperature. That the animal can maintain a body temperature different from the surroundings would be considered evidence of this regulating capability. Ten of these sea crabs were exposed to ambient temperatures of 24 degrees Celsius. Their body temperatures were measured with the results below: 24.33, 24.61, 24.67, 24.64, 24.42, 24.97, 25.23, 24.73, 24.90, 24.44 For purposes of this example, assume that it is reasonable to regard these 10 crabs as a random sample from the population of all crabs of this species.
a) Calculate a point estimate of the population mean.
b) Construct and interpret a 99% confidence interval for μ.
c) Does it appear from these data that the crabs are able to regulate their body temperature? Provide statistical justification for your response.
a) Calculate a point estimate of the population mean.
b) Construct and interpret a 99% confidence interval for μ.
c) Does it appear from these data that the crabs are able to regulate their body temperature? Provide statistical justification for your response.
Unlock Deck
Unlock for access to all 46 flashcards in this deck.
Unlock Deck
k this deck
28
If we were to construct a 95% confidence interval using the method to be described shortly,
A) we would be using a method that is "successful" 95% of the time.
B) we would be using a method that is "unsuccessful" 95% of the time.
C) we would be using a method that is "successful" 5% of the time.
D) we would be using a method that is "successful" all the time.
A) we would be using a method that is "successful" 95% of the time.
B) we would be using a method that is "unsuccessful" 95% of the time.
C) we would be using a method that is "successful" 5% of the time.
D) we would be using a method that is "successful" all the time.
Unlock Deck
Unlock for access to all 46 flashcards in this deck.
Unlock Deck
k this deck
29
Suppose that a newspaper conducts a survey of a random sample of 120 registered voters in order to predict the winner of a local election. The Republican candidate was favored by 62 of the respondents.
a) Construct and interpret a 99% CI for the true proportion of voters who prefer the Republican candidate.
b) If a candidate needs a simple majority of the votes to win the election, can the Republican candidate be confident of victory? Justify your response with an appropriate statistical argument.
Unlock Deck
Unlock for access to all 46 flashcards in this deck.
Unlock Deck
k this deck
30
A 1976 study of smokers over 30 years of age who delivered premature babies (fewer than 260 days of gestation) reported an infant survival rate of 72%. Suppose researchers would like to estimate the current survival rate. Based on the assumption that the survival rate today would be roughly similar to the survival rate in 1976, compute the sample size required to estimate the true survival proportion to within .05 with 95% confidence.
Unlock Deck
Unlock for access to all 46 flashcards in this deck.
Unlock Deck
k this deck
31
For a 95% confidence level, using the boundaries that capture the middle 95% of the simulated bootstrap distribution is equivalent to determining the endpoints of a confidence interval, which is represented as minus a number and plus a number. For bootstrap confidence intervals, the number subtracted from and the number added to are the same.
minus a number and plus a number. For bootstrap confidence intervals, the number subtracted from and the number added to are the same. Unlock Deck
Unlock for access to all 46 flashcards in this deck.
Unlock Deck
k this deck
32
Many national parks, wildlife refuges, and wilderness areas lie directly below designated military air space. This raises issues of whether wildlife and, for example, loud jet noises are compatible. In an effort to evaluate the effects of low-altitude jet-noise, researchers simulated these noises for captive desert mule deer. Three minutes after the loud noises were played, the heart rates (beats per minute) of these animals was measured, with the following results: 55.9, 51.1, 57.5, 65.5, 68.4, 64.9, 63.1, 55.3, 63.3 Assume that it is reasonable to think that these deer can be regarded as a random sample of desert mule deer.
a) Calculate and interpret a 95% confidence interval for the mean heart rate 3 minutes after loud jet noises.
b) The mean heart rate for desert mule deer is about 51.2 beats per minute. Based on the confidence interval in part (a), do you think that the loud jet noise has some lingering effect on the heart rate of desert mule deer? Explain.
Unlock Deck
Unlock for access to all 46 flashcards in this deck.
Unlock Deck
k this deck
33
At Abraham Lincoln High School a popular achievement test is used for college placement. Counselors selected a random sample of 100 students from Abraham Lincoln High School and scored their tests by hand before sending them in for computer processing. For this sample, and s = 25. Construct a 99% confidence interval for μ, the population mean score for Abraham Lincoln High.
and s = 25. Construct a 99% confidence interval for μ, the population mean score for Abraham Lincoln High. Unlock Deck
Unlock for access to all 46 flashcards in this deck.
Unlock Deck
k this deck
34
Reading comprehension is arguably the single most important skill a student possesses. To assess the current levels of reading comprehension in 3rd grade, 25 students were randomly selected from school district class lists and given a reading comprehension test. The distribution of their scores was approximately normal with a mean of 180 and a standard deviation of 20.12. Construct a 99% confidence interval for μ, the population mean.
Unlock Deck
Unlock for access to all 46 flashcards in this deck.
Unlock Deck
k this deck
35
The composition of the earth's atmosphere may have changed over time. One attempt to discover the nature of the atmosphere long ago involved measuring the gas trapped in bubbles inside ancient amber. Amber is tree resin that has hardened and been trapped in rocks. Measurements on nine amber specimens from the late Cretaceous era (95 to 65 million years ago) give the following percentages of nitrogen: 63.4, 65.0, 64.4, 63.3, 54.8, 68.5, 60.8, 59.1, 51.0 Assume that it is reasonable to regard these trapped gas bubbles as a random sample of bubbles from the Cretaceous atmosphere.
a) Construct and interpret a 95% confidence interval for the mean percentage of nitrogen in the Cretaceous atmosphere.
b) The mean percentage of nitrogen in the atmosphere today is about 79%. Based on the confidence interval from part (a), do you think that the percentage of the atmosphere that is nitrogen has changed from the late Cretaceous era? Explain.
Unlock Deck
Unlock for access to all 46 flashcards in this deck.
Unlock Deck
k this deck
36
In a very large school district student records have been kept in three distinct data bases, one each for elementary, middle, and high school. Because of this, data entry errors tend to be compounded as students move through the grades. The district now has a new data base and wishes to fix the original data entry errors. To allocate enough secretarial time to this task, an estimate of the proportion of records that contain errors must be made. Initial estimates are that there are fixable errors in about 15% of the records. Based on the 15% assumption, compute the sample size required to estimate the true proportion of records with errors to within .025 with 95% confidence.
Unlock Deck
Unlock for access to all 46 flashcards in this deck.
Unlock Deck
k this deck
37
When the sample size is "large enough," the statistic p has an approximately normal sampling distribution. How does one determine if a sample size is large enough?
Unlock Deck
Unlock for access to all 46 flashcards in this deck.
Unlock Deck
k this deck
38
A random sample of the houses in a particular city is selected and the level of radon gas is measured for each house in the sample. The values collected are given below in parts per million (ppm). Experience has shown that radon gas level is approximately normally distributed for this population. 4, 8, 13, 6, 7, 3, 9, 8, 11, 8 a) Calculate a point estimate of the population mean of radon gas levels. b) Construct and interpret a 99% confidence interval for μ. c) The city standards for radon call for no more than a level of 6 ppm. From these data, does it appear that the mean radon level for city houses is under 6 ppm? Provide statistical justification for your response.
Unlock Deck
Unlock for access to all 46 flashcards in this deck.
Unlock Deck
k this deck
39
The foraging capability of Downy Woodpeckers can be compromised if part of their habitat disappears due to significant human encroachment. These creatures eat insects in trees, and if they cannot find enough food due to a decreasing forest area their body mass may decrease. A 20-year-old study of Downy Woodpeckers indicates that for male Downy Woodpeckers the average mass is about 28g, with a standard deviation of approximately 1.5g. Suppose it is desired to estimate μ, the average mass of male Downy Woodpeckers in a local forest preserve. If the 20-year-old values are taken as reasonable estimates, determine the sample size necessary to estimate μ to within 0.2 grams with 95% confidence.
Unlock Deck
Unlock for access to all 46 flashcards in this deck.
Unlock Deck
k this deck
40
The size of the population does need to be considered if sampling is without replacement and the sample size is more than 10% of the population size. In this case, a finite population correction factor is used to adjust the margin of error (the given margin is multiplied by the correction factor). Since this correction factor is always less than 1, the adjusted margin of error is smaller.
is used to adjust the margin of error (the given margin is multiplied by the correction factor). Since this correction factor is always less than 1, the adjusted margin of error is smaller. Unlock Deck
Unlock for access to all 46 flashcards in this deck.
Unlock Deck
k this deck
41
For a 95% confidence level, using the boundaries that capture the middle 95% of the bootstrap distribution is equivalent to getting a value for minus a number, and for plus a number. The numbers subtracted and added won't be the same since the bootstrap distribution would not be symmetric.
minus a number, and for plus a number. The numbers subtracted and added won't be the same since the bootstrap distribution would not be symmetric. Unlock Deck
Unlock for access to all 46 flashcards in this deck.
Unlock Deck
k this deck
42
When are the population mean and the population median equal?
A) always
B) never
C) if the population distribution is symmetric
D) if the number of observations is even
A) always
B) never
C) if the population distribution is symmetric
D) if the number of observations is even
Unlock Deck
Unlock for access to all 46 flashcards in this deck.
Unlock Deck
k this deck
43
Would it be appropriate to use a bootstrap confidence interval for the given distribution of a sample mean?
Unlock Deck
Unlock for access to all 46 flashcards in this deck.
Unlock Deck
k this deck
44
Over the last year, there were 80 sunny days. You can be 90% confident that the true proportion of sunny days in your life is between 0.184 and 0.255. Assume there are 365 days in a year.
Unlock Deck
Unlock for access to all 46 flashcards in this deck.
Unlock Deck
k this deck
45
A random sample of 150 employees was selected. There are 60 employees older than 30 in the sample. Estimate the proportion of all employees of the company who are older than 30 with a 50% confidence.
A) We can be 50% confident that the true proportion of all employees of the company who are older than 30 is 0.4.
B) We can be 50% confident that the true proportion of all employees of the company who are older than 30 falls within the interval (0.334, 0.466).
C) We can be 50% confident that the true proportion of all employees of the company who are older than 30 falls within the interval (0.322, 0.478).
D) We can be 50% confident that the true proportion of all employees of the company who are older than 30 falls within the interval (0.38, 0.42).
E) We can be 50% confident that the true proportion of all employees of the company who are older than 30 falls within the interval (0.36, 0.44).
Unlock Deck
Unlock for access to all 46 flashcards in this deck.
Unlock Deck
k this deck
46
You are stuck in a long traffic jam of about 100 cars. While waiting, you talked a little to 7 drivers of the closest cars and realized that 5 of them seemed completely calm about the situation. Which method will be effective to use in order to estimate the proportion of calm people in the traffic jam and construct a confidence interval?
A) large-sample method
B) bootstrap method
A) large-sample method
B) bootstrap method
Unlock Deck
Unlock for access to all 46 flashcards in this deck.
Unlock Deck
k this deck
Unlock Deck
Unlock for access to all 46 flashcards in this deck.


