Deck 14: Multiple Regression Analysis
Full screen (f)
Question
Question
Question
Question
Question
Question
The standard deviation of  used in a prediction interval is
  .
.
used in a prediction interval is . Question
The estimated regression function 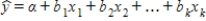 is used for both estimating the mean value of y and predicting the value of y when x1, x2, ..., xk are fixed values.
is used for both estimating the mean value of y and predicting the value of y when x1, x2, ..., xk are fixed values. Question
Question
Question
Question
Question
Question
Question
Question
Question
Question
Question
Question
Question
Question
A Senate committee is studying the cost of health care and is interested in the relationship between y = the monthly premium paid, x1 = the age of the policy holder, and x2 = the number of dependents on the policy. Partial computer output for the Senate study is given below. The regression equation is Prem = 177 + 1.3 x1 + 68 x2 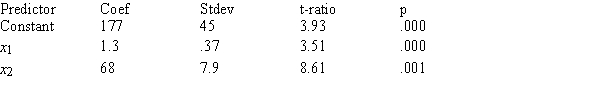 S = 17.25 R-sq = 59.1%
 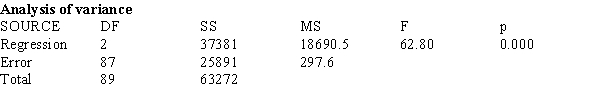 Use a significance level of .05 for all tests requested.
a) Calculate and interpret a 95% confidence interval for β2.
b) Does the model appear to be useful? Test the relevant hypothesis.
c) Conduct a test for the following pair of hypotheses: H0 : β1 = 0 vs. β1 ≠ 0.
d) Based on your result in part (c), would you conclude that the age of the policy holder is an important variable? Explain your reasoning.
e) An estimate of the mean monthly premium for a policy holder 23 years old with 2 dependents is desired. Compute a 90% confidence interval for α + β1(23) + β2(2) if the estimated standard deviation of a + b1(23) + b2(2) is 35. Interpret the resulting interval.
f) A single individual, 23 years old with 2 dependents, is identified. Predict the monthly premium for this person using a 90% interval.
S = 17.25 R-sq = 59.1% Use a significance level of .05 for all tests requested. a) Calculate and interpret a 95% confidence interval for β2.
b) Does the model appear to be useful? Test the relevant hypothesis.
c) Conduct a test for the following pair of hypotheses: H0 : β1 = 0 vs. β1 ≠ 0.
d) Based on your result in part (c), would you conclude that the age of the policy holder is an important variable? Explain your reasoning.
e) An estimate of the mean monthly premium for a policy holder 23 years old with 2 dependents is desired. Compute a 90% confidence interval for α + β1(23) + β2(2) if the estimated standard deviation of a + b1(23) + b2(2) is 35. Interpret the resulting interval.
f) A single individual, 23 years old with 2 dependents, is identified. Predict the monthly premium for this person using a 90% interval.
Question
Question
Question
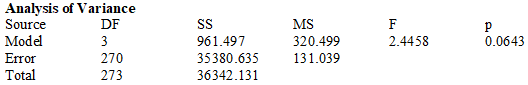
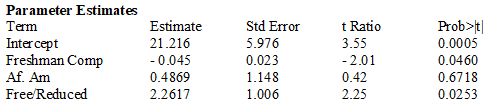
Exhibit 14-1 To comply with recent Federal legislation, school districts must study their students' growth as a whole, as well as the achievement of various subgroups of students. Over a 3-day period, students are assessed on their reading achievement, science and math knowledge, and social studies skills and these results are combined into a global "composite" score. To analyze the increase in this global score from the Freshman year to the Sophomore year, the model y = α + β1x1 + β2x2 + e was fit to a sample of student data. (The actual data contained categorical variables for each ethnic subgroup. To simplify the analysis, only the African American / White categorical variable is included here.)
y = growth in composite score (Soph. - Fresh. score)
x1 = last year's composite score
x2 = 1 if a student is African American, 0 if white
x3 = 1 if a student receives free or reduced price lunch (a measure of socio-economic status), 0 if not
The computer output from the regression analysis is shown below.
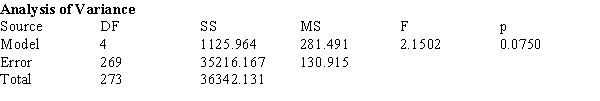
The data in Exhibit 14-1 were reanalyzed after adding an interaction variable, AAFR, where x4 = x2x3. The computer output is shown below: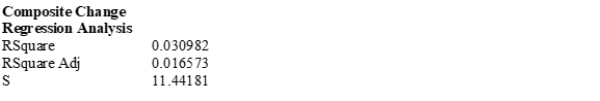
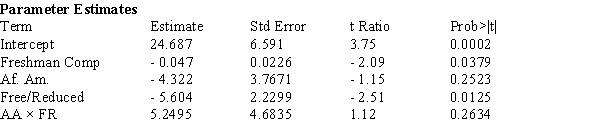
a) Is the Model Utility test significant at the .10 level? Explain your reasoning, referring to specific information in the computer output.
b) Calculate the expected mean growth in composite score for African-American students who scored 280 as Freshmen and are receiving free/reduced lunch.
c) One concern the Federal legislation is intended to address are differences in the school's impact on disadvantaged youngsters. Using the computer output from the interaction model, what, if any, differences in growth scores on the Composite Score from the Freshman to Sophomore year are statistically significant at the .05 level? Does it appear that the different subgroups have different amounts of growth? Justify your reasoning with appropriate references to the data analysis presented in the computer output.
y = growth in composite score (Soph. - Fresh. score)
x1 = last year's composite score
x2 = 1 if a student is African American, 0 if white
x3 = 1 if a student receives free or reduced price lunch (a measure of socio-economic status), 0 if not
The computer output from the regression analysis is shown below.
The data in Exhibit 14-1 were reanalyzed after adding an interaction variable, AAFR, where x4 = x2x3. The computer output is shown below:
a) Is the Model Utility test significant at the .10 level? Explain your reasoning, referring to specific information in the computer output.
b) Calculate the expected mean growth in composite score for African-American students who scored 280 as Freshmen and are receiving free/reduced lunch.
c) One concern the Federal legislation is intended to address are differences in the school's impact on disadvantaged youngsters. Using the computer output from the interaction model, what, if any, differences in growth scores on the Composite Score from the Freshman to Sophomore year are statistically significant at the .05 level? Does it appear that the different subgroups have different amounts of growth? Justify your reasoning with appropriate references to the data analysis presented in the computer output.
Question
Journalists are trying to find out the main factors used by a railway company in establishing dynamic pricing for tickets. One of the possible regression models, based on the information on 20 tickets, is y = Price for a railway ticket ($) x1 = Number of days before departure x2 = Weekday (1 = Fri/Sat/Sun, 0 = Mon/Tue/Wen/Thu) x3 = Distance (km) x4 = Demand (1 to 5 scale) Using the Minitab output results from fitting this model, carry out the model utility test at a 0.05 significance level. 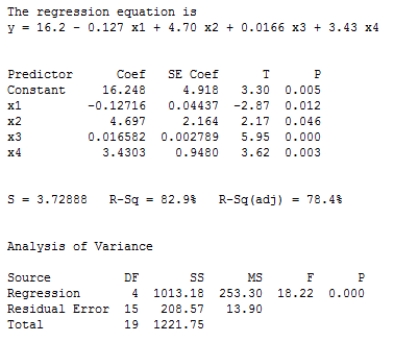
A) P-value < 0.05, there appears to be a useful linear relationship between y and at least one of the three predictors.
B) P-value < 0.05, there appears to be a useful linear relationship between y and each of the three predictors.
C) P-value > 0.05, there is no useful linear relationship between y and any of the predictors.
D) P-value > 0.05, there is a useful linear relationship between y and each of the three predictors.
E) P-value > 0.05, there is no useful linear relationship between y and at least one of the predictors.
Question
Question
Question
Consider a regression analysis with four independent variables x1, x2, x3, and x4. Select the equation for the regression model that includes all independent variables as predictors, two interaction terms, and one quadratic term.
A)
B)
C)
D)
E)
A)
B)
C)
D)
E)
Question
Exhibit 14-1 To comply with recent Federal legislation, school districts must study their students' growth as a whole, as well as the achievement of various subgroups of students. Over a 3-day period, students are assessed on their reading achievement, science and math knowledge, and social studies skills and these results are combined into a global "composite" score. To analyze the increase in this global score from the Freshman year to the Sophomore year, the model y = α + β1x1 + β2x2 + e was fit to a sample of student data. (The actual data contained categorical variables for each ethnic subgroup. To simplify the analysis, only the African American / White categorical variable is included here.)
y = growth in composite score (Soph. - Fresh. score)
x1 = last year's composite score
x2 = 1 if a student is African American, 0 if white
x3 = 1 if a student receives free or reduced price lunch (a measure of socio-economic status), 0 if not
The computer output from the regression analysis is shown below.
Refer to Exhibit 14-1. a) Is the Model Utility test significant at the .10 level? Explain your reasoning, referring to specific information in the computer output.
b) Calculate the estimated mean growth in composite score for white students who scored 280 as Freshmen and who are receiving free/reduced lunch.
Question
Question
Question
The Carolina Reaper pepper is considered one of the hottest peppers in the world. However, manufacturers of sauces made from Carolina Reaper often overstate the pungency given on the package to separate their product and ensure sales. An independent laboratory provided a multiple regression model for determining the pungency of the sauce based on a sample of n = 20 sauces. y = Pungency of a sauce (Scoville heat units) x1 = Carolina Reaper content (%) x2 = Sugar content (%) x3 = Vinegar content (%) The estimated regression function was  and R2 = 0.979. Does the result of a model utility test at α = 0.01 indicate that this multiple regression model is useful? Assume that the random deviation distribution is normal.
A) P-value < 0.001, there appears to be a useful linear relationship between y and each of the three predictors.
B) P-value > 0.01, there is no useful linear relationship between y and any of the predictors.
C) P-value < 0.001, there appears to be a useful linear relationship between y and at least one of the three predictors.
D) 0.001< P-value < 0.01, there is a useful linear relationship between y and each of the three predictors.
E) P-value > 0.01, there is no useful linear relationship between y and at least one of the predictors.
and R2 = 0.979. Does the result of a model utility test at α = 0.01 indicate that this multiple regression model is useful? Assume that the random deviation distribution is normal. A) P-value < 0.001, there appears to be a useful linear relationship between y and each of the three predictors.
B) P-value > 0.01, there is no useful linear relationship between y and any of the predictors.
C) P-value < 0.001, there appears to be a useful linear relationship between y and at least one of the three predictors.
D) 0.001< P-value < 0.01, there is a useful linear relationship between y and each of the three predictors.
E) P-value > 0.01, there is no useful linear relationship between y and at least one of the predictors.
Question
Question
Question
The president of a manufacturing firm used a regression model of the form y = α + β1x1 + β2x2 + β3x3 + e to study the relationship between the variables
y = production cost (in dollars)
x1 = machine time to produce one unit of the product (in minutes)
x2 = material and labor costs per unit (in dollars)
x3 = percentage of defective products produced All of seven of the possible models containing combinations of these three variables were fit resulting in the summary table below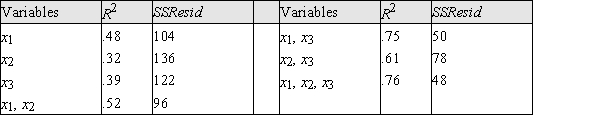
a) If n = 20, compute the value of the adjusted R2 statistic for each of the 7 models.
b) Which of the single variable models is the best? Explain your choice in a few sentences.
c) Let model A be the model with variables x1, x2, and model B be the model with variables x1, x2, x3. Which of these two models appears to be the better model? Explain your choice in a few sentences.
d) Which of the seven models appears to be the best overall model? Explain your choice in a few sentences.
Question
Question
A producer of stainless steel products presented data on y = Workshop expenses (thousands of dollars) as a function of x1 = Amount of raw material (tons), x2 = Number of hours worked (hundreds), and x3 = Quantity of production (thousands of units). Suppose that there is an interaction between the amount of raw material and the quantity of production. What additional predictor variable should be added to the model?
A)
B)
C)
D)
E)
A)
B)
C)
D)
E)
Question

Unlock Deck
Sign up to unlock the cards in this deck!
Unlock Deck
Unlock Deck
1/38
Play
Full screen (f)
Deck 14: Multiple Regression Analysis
1
The interaction between two variables x1 and x2 can be modeled by including the predictor variable β1β2 into the multiple regression model.
False
2
When fitting a multiple regression model is desirable to have both a large value of R2 and a small value of se.
True
3
SSRegr + SSResid = SSTo.
True
4
Two variables x1 and x2 are said to interact when the change in the mean value of y associated with a one unit increase in one variable depends on the value of the other variable.
Unlock Deck
Unlock for access to all 38 flashcards in this deck.
Unlock Deck
k this deck
5
In the general multiple regression model, y = α + β1x1 + β2x2 + ... + βkxk + e, each observation in the sample consists of k + 1 numbers.
Unlock Deck
Unlock for access to all 38 flashcards in this deck.
Unlock Deck
k this deck
6
The standard deviation of used in a prediction interval is .
used in a prediction interval is . Unlock Deck
Unlock for access to all 38 flashcards in this deck.
Unlock Deck
k this deck
7
The estimated regression function is used for both estimating the mean value of y and predicting the value of y when x1, x2, ..., xk are fixed values.
is used for both estimating the mean value of y and predicting the value of y when x1, x2, ..., xk are fixed values. Unlock Deck
Unlock for access to all 38 flashcards in this deck.
Unlock Deck
k this deck
8
The predicted values, the residuals and SSResid for a multiple regression model are interpreted as they were for the simple linear regression model.
Unlock Deck
Unlock for access to all 38 flashcards in this deck.
Unlock Deck
k this deck
9
The alternative hypothesis in the model utility test is Ha : none of the β's are 0.
Unlock Deck
Unlock for access to all 38 flashcards in this deck.
Unlock Deck
k this deck
10
A variable taking on only the values 0 and 1 is called a dummy or indicator variable.
Unlock Deck
Unlock for access to all 38 flashcards in this deck.
Unlock Deck
k this deck
11
The least squares estimate of β1 is an unbiased statistic for estimating βi.
Unlock Deck
Unlock for access to all 38 flashcards in this deck.
Unlock Deck
k this deck
12
A complete second order regression model in the variables x1 and x2 is given by y = α + β1x1 + β2x2 + β3x12 + β4x22 +
e.
e.
Unlock Deck
Unlock for access to all 38 flashcards in this deck.
Unlock Deck
k this deck
13
It is possible to carry out the model utility test of H0 : β1 = β2 = ... = βk = 0 when only R2, n, and k are known.
Unlock Deck
Unlock for access to all 38 flashcards in this deck.
Unlock Deck
k this deck
14
In a multiple regression model, the utility of the model can be tested with a t test.
Unlock Deck
Unlock for access to all 38 flashcards in this deck.
Unlock Deck
k this deck
15
The polynomial regression model used to fit a parabolic pattern in the observed data is y = α + β1x + β2x2 +
e.
e.
Unlock Deck
Unlock for access to all 38 flashcards in this deck.
Unlock Deck
k this deck
16
In the quadratic regression model, y = α + β1x + β2x2 + e, β2 can be interpreted as the amount that y will be expected to change when the value of x is increased by one unit.
Unlock Deck
Unlock for access to all 38 flashcards in this deck.
Unlock Deck
k this deck
17
A general additive multiple regression model has the form y = α + β1x1 + β2x2 + ... + βkxk.
Unlock Deck
Unlock for access to all 38 flashcards in this deck.
Unlock Deck
k this deck
18
In the quadratic regression model, y = α + β1x + β2x2 + e, the parabola opens upward when β2 > 0 and downward when β2 < 0.
Unlock Deck
Unlock for access to all 38 flashcards in this deck.
Unlock Deck
k this deck
19
In the general additive regression model, the mean value of y for fixed x1, x2, ... xk values is α + β1 + β2 + ... + βk.
Unlock Deck
Unlock for access to all 38 flashcards in this deck.
Unlock Deck
k this deck
20
The value of adjusted R2 is always smaller than the value of R2.
Unlock Deck
Unlock for access to all 38 flashcards in this deck.
Unlock Deck
k this deck
21
A Senate committee is studying the cost of health care and is interested in the relationship between y = the monthly premium paid, x1 = the age of the policy holder, and x2 = the number of dependents on the policy. Partial computer output for the Senate study is given below. The regression equation is Prem = 177 + 1.3 x1 + 68 x2 S = 17.25 R-sq = 59.1% Use a significance level of .05 for all tests requested.
a) Calculate and interpret a 95% confidence interval for β2.
b) Does the model appear to be useful? Test the relevant hypothesis.
c) Conduct a test for the following pair of hypotheses: H0 : β1 = 0 vs. β1 ≠ 0.
d) Based on your result in part (c), would you conclude that the age of the policy holder is an important variable? Explain your reasoning.
e) An estimate of the mean monthly premium for a policy holder 23 years old with 2 dependents is desired. Compute a 90% confidence interval for α + β1(23) + β2(2) if the estimated standard deviation of a + b1(23) + b2(2) is 35. Interpret the resulting interval.
f) A single individual, 23 years old with 2 dependents, is identified. Predict the monthly premium for this person using a 90% interval.
S = 17.25 R-sq = 59.1% Use a significance level of .05 for all tests requested. a) Calculate and interpret a 95% confidence interval for β2.
b) Does the model appear to be useful? Test the relevant hypothesis.
c) Conduct a test for the following pair of hypotheses: H0 : β1 = 0 vs. β1 ≠ 0.
d) Based on your result in part (c), would you conclude that the age of the policy holder is an important variable? Explain your reasoning.
e) An estimate of the mean monthly premium for a policy holder 23 years old with 2 dependents is desired. Compute a 90% confidence interval for α + β1(23) + β2(2) if the estimated standard deviation of a + b1(23) + b2(2) is 35. Interpret the resulting interval.
f) A single individual, 23 years old with 2 dependents, is identified. Predict the monthly premium for this person using a 90% interval.
Unlock Deck
Unlock for access to all 38 flashcards in this deck.
Unlock Deck
k this deck
22
Briefly explain what it means when two variables are said to interact.
Unlock Deck
Unlock for access to all 38 flashcards in this deck.
Unlock Deck
k this deck
23
Estimate the P-value for the model utility F test given that k = 4, n = 27, calculated F = 2.81.
A) P-value < 0.001
B) 0.001 < P-value < 0.01
C) 0.01 < P-value < 0.05
D) 0.05 < P-value < 0.1
E) P-value > 0.1
A) P-value < 0.001
B) 0.001 < P-value < 0.01
C) 0.01 < P-value < 0.05
D) 0.05 < P-value < 0.1
E) P-value > 0.1
Unlock Deck
Unlock for access to all 38 flashcards in this deck.
Unlock Deck
k this deck
24
Exhibit 14-1 To comply with recent Federal legislation, school districts must study their students' growth as a whole, as well as the achievement of various subgroups of students. Over a 3-day period, students are assessed on their reading achievement, science and math knowledge, and social studies skills and these results are combined into a global "composite" score. To analyze the increase in this global score from the Freshman year to the Sophomore year, the model y = α + β1x1 + β2x2 + e was fit to a sample of student data. (The actual data contained categorical variables for each ethnic subgroup. To simplify the analysis, only the African American / White categorical variable is included here.)
y = growth in composite score (Soph. - Fresh. score)
x1 = last year's composite score
x2 = 1 if a student is African American, 0 if white
x3 = 1 if a student receives free or reduced price lunch (a measure of socio-economic status), 0 if not
The computer output from the regression analysis is shown below.
The data in Exhibit 14-1 were reanalyzed after adding an interaction variable, AAFR, where x4 = x2x3. The computer output is shown below:
a) Is the Model Utility test significant at the .10 level? Explain your reasoning, referring to specific information in the computer output.
b) Calculate the expected mean growth in composite score for African-American students who scored 280 as Freshmen and are receiving free/reduced lunch.
c) One concern the Federal legislation is intended to address are differences in the school's impact on disadvantaged youngsters. Using the computer output from the interaction model, what, if any, differences in growth scores on the Composite Score from the Freshman to Sophomore year are statistically significant at the .05 level? Does it appear that the different subgroups have different amounts of growth? Justify your reasoning with appropriate references to the data analysis presented in the computer output.
Unlock Deck
Unlock for access to all 38 flashcards in this deck.
Unlock Deck
k this deck
25
Journalists are trying to find out the main factors used by a railway company in establishing dynamic pricing for tickets. One of the possible regression models, based on the information on 20 tickets, is y = Price for a railway ticket ($) x1 = Number of days before departure x2 = Weekday (1 = Fri/Sat/Sun, 0 = Mon/Tue/Wen/Thu) x3 = Distance (km) x4 = Demand (1 to 5 scale) Using the Minitab output results from fitting this model, carry out the model utility test at a 0.05 significance level.
A) P-value < 0.05, there appears to be a useful linear relationship between y and at least one of the three predictors.
B) P-value < 0.05, there appears to be a useful linear relationship between y and each of the three predictors.
C) P-value > 0.05, there is no useful linear relationship between y and any of the predictors.
D) P-value > 0.05, there is a useful linear relationship between y and each of the three predictors.
E) P-value > 0.05, there is no useful linear relationship between y and at least one of the predictors.
Unlock Deck
Unlock for access to all 38 flashcards in this deck.
Unlock Deck
k this deck
26
The cost of renting premises consists of a plurality of parameters. A real estate company attempts to identify the most significant factors and proposes a multiple regression model based on a sample of n = 18 observations. y = Monthly rent ($) x1 = Surface area (m2) x2 = Historic building (1 = yes, 0 = no) x3 = Prestige of a district (1 to 5 scale) x4 = Parking facilities (1 = yes, 0 = no) x5 = Availability of infrastructure (1 to 5 scale) Suppose that SSRegr = 846,325 and SSTo = 3,900,000. Calculate the values of R2 and adjusted R2. Explain the difference between them.
A) Adjusted R2 is significantly smaller than R2, because R2 itself is rather small.
B) Adjusted R2 is significantly smaller than R2, because the number of predictors is large as compared to the number of observations.
C) Adjusted R2 is significantly larger than R2, because R2 itself is rather small.
D) Adjusted R2 is significantly greater than R2, because the number of predictors is large as compared to the number of observations.
E) The difference between adjusted R2 and R2 is not significant, because R2 is substantial and there are only a few predictors.
Unlock Deck
Unlock for access to all 38 flashcards in this deck.
Unlock Deck
k this deck
27
The owners of an online shop use a multiple regression model with three independent variables where y = Shipping Cost ($) x1 = Product weight (kg) x2 = Number of items x3 = Total amount ($) The regression model is y = 8.50 + 12x1 + 0.1x2 + 0.05x3 + 0.08x2x3 + e Interpret the value of β1 for this model.
A) The average change in shipping costs associated with an increase in the number of items by 1 when the product weight and the total amount are held fixed.
B) The average change in shipping costs associated with a 1-dollar increase in the total amount when the product weight and the number of items are held fixed.
C) The difference between the slopes of regression lines depending on the total amount and the number of items.
D) The average change in shipping costs associated with a 1-kg increase in product weight when the number of items and the total amount are held fixed.
E) The average change in shipping costs when the perceived increase value of the number of items by 1 unit depends on the change of the total amount.
Unlock Deck
Unlock for access to all 38 flashcards in this deck.
Unlock Deck
k this deck
28
Consider a regression analysis with four independent variables x1, x2, x3, and x4. Select the equation for the regression model that includes all independent variables as predictors, two interaction terms, and one quadratic term.
A)
B)
C)
D)
E)
A)
B)
C)
D)
E)
Unlock Deck
Unlock for access to all 38 flashcards in this deck.
Unlock Deck
k this deck
29
Exhibit 14-1 To comply with recent Federal legislation, school districts must study their students' growth as a whole, as well as the achievement of various subgroups of students. Over a 3-day period, students are assessed on their reading achievement, science and math knowledge, and social studies skills and these results are combined into a global "composite" score. To analyze the increase in this global score from the Freshman year to the Sophomore year, the model y = α + β1x1 + β2x2 + e was fit to a sample of student data. (The actual data contained categorical variables for each ethnic subgroup. To simplify the analysis, only the African American / White categorical variable is included here.)
y = growth in composite score (Soph. - Fresh. score)
x1 = last year's composite score
x2 = 1 if a student is African American, 0 if white
x3 = 1 if a student receives free or reduced price lunch (a measure of socio-economic status), 0 if not
The computer output from the regression analysis is shown below.
Refer to Exhibit 14-1. a) Is the Model Utility test significant at the .10 level? Explain your reasoning, referring to specific information in the computer output.
b) Calculate the estimated mean growth in composite score for white students who scored 280 as Freshmen and who are receiving free/reduced lunch.
Unlock Deck
Unlock for access to all 38 flashcards in this deck.
Unlock Deck
k this deck
30
Including an additional predictor to a multiple regression model will always increase the value of the adjusted R2 value.
Unlock Deck
Unlock for access to all 38 flashcards in this deck.
Unlock Deck
k this deck
31
Multicollinearity is a model selection procedure that can be used to compare different models.
Unlock Deck
Unlock for access to all 38 flashcards in this deck.
Unlock Deck
k this deck
32
The Carolina Reaper pepper is considered one of the hottest peppers in the world. However, manufacturers of sauces made from Carolina Reaper often overstate the pungency given on the package to separate their product and ensure sales. An independent laboratory provided a multiple regression model for determining the pungency of the sauce based on a sample of n = 20 sauces. y = Pungency of a sauce (Scoville heat units) x1 = Carolina Reaper content (%) x2 = Sugar content (%) x3 = Vinegar content (%) The estimated regression function was and R2 = 0.979. Does the result of a model utility test at α = 0.01 indicate that this multiple regression model is useful? Assume that the random deviation distribution is normal.
A) P-value < 0.001, there appears to be a useful linear relationship between y and each of the three predictors.
B) P-value > 0.01, there is no useful linear relationship between y and any of the predictors.
C) P-value < 0.001, there appears to be a useful linear relationship between y and at least one of the three predictors.
D) 0.001< P-value < 0.01, there is a useful linear relationship between y and each of the three predictors.
E) P-value > 0.01, there is no useful linear relationship between y and at least one of the predictors.
and R2 = 0.979. Does the result of a model utility test at α = 0.01 indicate that this multiple regression model is useful? Assume that the random deviation distribution is normal. A) P-value < 0.001, there appears to be a useful linear relationship between y and each of the three predictors.
B) P-value > 0.01, there is no useful linear relationship between y and any of the predictors.
C) P-value < 0.001, there appears to be a useful linear relationship between y and at least one of the three predictors.
D) 0.001< P-value < 0.01, there is a useful linear relationship between y and each of the three predictors.
E) P-value > 0.01, there is no useful linear relationship between y and at least one of the predictors.
Unlock Deck
Unlock for access to all 38 flashcards in this deck.
Unlock Deck
k this deck
33
Briefly explain how to interpret the value of β1 in the model y = α + β1x1 + β2x2 + e, when the variables x1 and x2 are independent.
Unlock Deck
Unlock for access to all 38 flashcards in this deck.
Unlock Deck
k this deck
34
How do the R2 and adjusted R2 differ?
Unlock Deck
Unlock for access to all 38 flashcards in this deck.
Unlock Deck
k this deck
35
The president of a manufacturing firm used a regression model of the form y = α + β1x1 + β2x2 + β3x3 + e to study the relationship between the variables
y = production cost (in dollars)
x1 = machine time to produce one unit of the product (in minutes)
x2 = material and labor costs per unit (in dollars)
x3 = percentage of defective products produced All of seven of the possible models containing combinations of these three variables were fit resulting in the summary table below
a) If n = 20, compute the value of the adjusted R2 statistic for each of the 7 models.
b) Which of the single variable models is the best? Explain your choice in a few sentences.
c) Let model A be the model with variables x1, x2, and model B be the model with variables x1, x2, x3. Which of these two models appears to be the better model? Explain your choice in a few sentences.
d) Which of the seven models appears to be the best overall model? Explain your choice in a few sentences.
y = production cost (in dollars)
x1 = machine time to produce one unit of the product (in minutes)
x2 = material and labor costs per unit (in dollars)
x3 = percentage of defective products produced All of seven of the possible models containing combinations of these three variables were fit resulting in the summary table below
a) If n = 20, compute the value of the adjusted R2 statistic for each of the 7 models.
b) Which of the single variable models is the best? Explain your choice in a few sentences.
c) Let model A be the model with variables x1, x2, and model B be the model with variables x1, x2, x3. Which of these two models appears to be the better model? Explain your choice in a few sentences.
d) Which of the seven models appears to be the best overall model? Explain your choice in a few sentences.
Unlock Deck
Unlock for access to all 38 flashcards in this deck.
Unlock Deck
k this deck
36
The largest R2 for any two-predictor model is always less than or equal to the largest R2 for any three-predictor model.
Unlock Deck
Unlock for access to all 38 flashcards in this deck.
Unlock Deck
k this deck
37
A producer of stainless steel products presented data on y = Workshop expenses (thousands of dollars) as a function of x1 = Amount of raw material (tons), x2 = Number of hours worked (hundreds), and x3 = Quantity of production (thousands of units). Suppose that there is an interaction between the amount of raw material and the quantity of production. What additional predictor variable should be added to the model?
A)
B)
C)
D)
E)
A)
B)
C)
D)
E)
Unlock Deck
Unlock for access to all 38 flashcards in this deck.
Unlock Deck
k this deck
38
A normal probability plot of the standardized residuals can be used to investigate whether it is plausible that the distribution of e is approximately normal.
Unlock Deck
Unlock for access to all 38 flashcards in this deck.
Unlock Deck
k this deck
Unlock Deck
Unlock for access to all 38 flashcards in this deck.


