Deck 13: Factor Markets
Full screen (f)
Question
Question
Use the following to answer questions 13-15:
Figure 13.2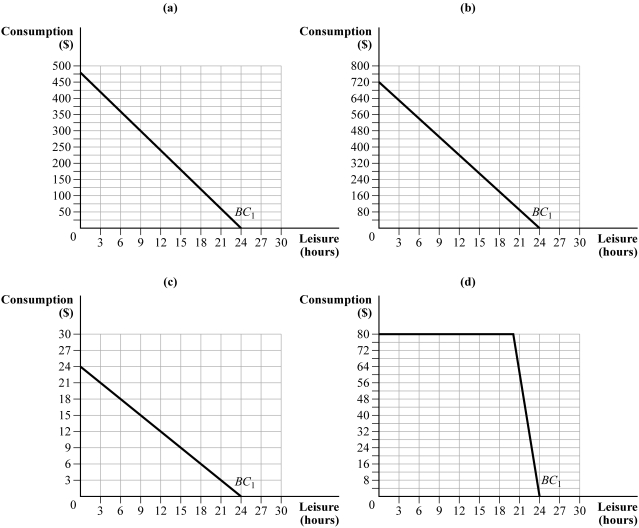
(Figure 13.2) If Louise was getting paid $20 per hour, then received a raise of $10 per hour, which graph would best illustrate her budget constraint?
A) (a)
B) (b)
C) (c)
D) (d)
Figure 13.2
(Figure 13.2) If Louise was getting paid $20 per hour, then received a raise of $10 per hour, which graph would best illustrate her budget constraint?
A) (a)
B) (b)
C) (c)
D) (d)
Question
Use the following to answer questions 13-15:
Figure 13.2
(Figure 13.2) If Louise gets paid $20 per hour, which graph best illustrates her budget constraint?
A) (a)
B) (b)
C) (c)
D) (d)
Figure 13.2
(Figure 13.2) If Louise gets paid $20 per hour, which graph best illustrates her budget constraint?
A) (a)
B) (b)
C) (c)
D) (d)
Question
Use the following to answer questions 8-11:
Figure 13.1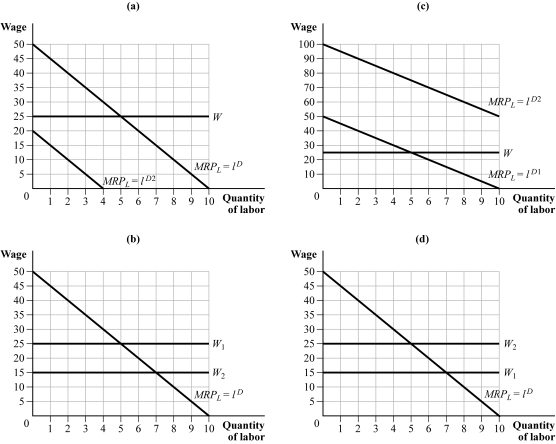
(Figure 13.1) Assume that the price per pound of apples has increased. Which graph best illustrates this change?
A) (a)
B) (b)
C) (c)
D) (d)
Figure 13.1
(Figure 13.1) Assume that the price per pound of apples has increased. Which graph best illustrates this change?
A) (a)
B) (b)
C) (c)
D) (d)
Question
Use the following to answer questions 16-17:
Figure 13.3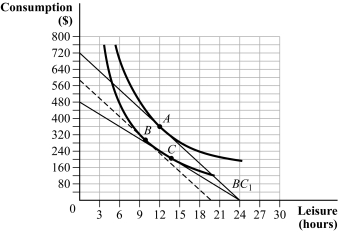
(Figure 13.3) The figure shows budget constraints and indifference curves for a representative individual. Identify the substitution effect of the increase in the wage rate in the associated graph.
A) C to B
B) B to A
C) A to C
D) A to B
Figure 13.3
(Figure 13.3) The figure shows budget constraints and indifference curves for a representative individual. Identify the substitution effect of the increase in the wage rate in the associated graph.
A) C to B
B) B to A
C) A to C
D) A to B
Question
Use the following to answer questions 5-7:
Table 13.1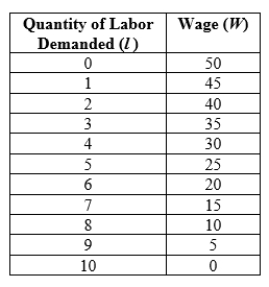
(Table 13.1) The table shows the quantity of labor demanded at different wage rates. Which of the following statements is TRUE? I. When the market wage is $25 and the firm hires 7 workers, the benefit of hiring the seventh worker is greater than the costs of hiring the seventh worker.
II) When the market wage is $25 and the firm hires 4 workers, the benefit of hiring the fourth worker is less than the costs of hiring the fourth worker.
III) When the market wage is $25 and the firm hires 5 workers, the benefit of hiring the fifth worker on the margin equals the costs on the margin of hiring the fifth worker.
A) I
B) I and II
C) III
D) I and III
Question
Use the following to answer questions 13-15:
Figure 13.2
(Figure 13.2) If Louise earns $20 per hour but can work only 4 hours per day, which graph best illustrates her budget constraint?
A) (a)
B) (b)
C) (c)
D) (d)
Figure 13.2
(Figure 13.2) If Louise earns $20 per hour but can work only 4 hours per day, which graph best illustrates her budget constraint?
A) (a)
B) (b)
C) (c)
D) (d)
Question
Use the following to answer questions 19-20:
Table 13.2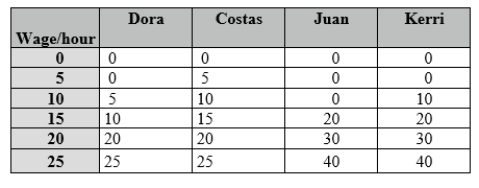
(Table 13.2) The table shows the number of labor hours supplied per worker for various hourly wage rates. The correct market-level labor supply curve is:
A)
B)
C)
D)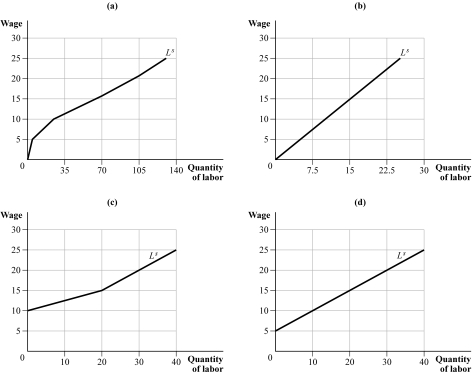
Table 13.2
(Table 13.2) The table shows the number of labor hours supplied per worker for various hourly wage rates. The correct market-level labor supply curve is:
A)
B)
C)
D)
Question
Question
Use the following to answer questions 8-11:
Figure 13.1
(Figure 13.1) Assume that the marginal productivity of apple pickers has increased. Which graph best illustrates this change?
A) (a)
B) (b)
C) (c)
D) (d)
Figure 13.1
(Figure 13.1) Assume that the marginal productivity of apple pickers has increased. Which graph best illustrates this change?
A) (a)
B) (b)
C) (c)
D) (d)
Question
Question
Use the following to answer questions 5-7:
Table 13.1
(Table 13.1) If the market wage is $25, the firm should hire _____ workers.
A) 5
B) 4
C) 3
D) 6
Table 13.1
(Table 13.1) If the market wage is $25, the firm should hire _____ workers.
A) 5
B) 4
C) 3
D) 6
Question
Question
Use the following to answer questions 19-20:
Table 13.2
(Table 13.2) The table shows the number of labor hours supplied per worker for various hourly wage rates. The total amount of labor hours supplied at $20 per hour is:
A)20.
B)30.
C)90.
D) 100.
Table 13.2
(Table 13.2) The table shows the number of labor hours supplied per worker for various hourly wage rates. The total amount of labor hours supplied at $20 per hour is:
A)20.
B)30.
C)90.
D) 100.
Question
Question
Use the following to answer questions 8-11:
Figure 13.1
(Figure 13.1) There is a decrease in total factor productivity. Which graph best illustrates this change?
A) (a)
B) (b)
C) (c)
D) (d)
Figure 13.1
(Figure 13.1) There is a decrease in total factor productivity. Which graph best illustrates this change?
A) (a)
B) (b)
C) (c)
D) (d)
Question
Question
Use the following to answer questions 8-11:
Figure 13.1
(Figure 13.1) Assume that there is a decrease in the wage paid to apple pickers. Which graph best illustrates this change?
A) (a)
B) (b)
C) (c)
D) (d)
Figure 13.1
(Figure 13.1) Assume that there is a decrease in the wage paid to apple pickers. Which graph best illustrates this change?
A) (a)
B) (b)
C) (c)
D) (d)
Question
Use the following to answer questions 5-7:
Table 13.1
(Table 13.1) The choke wage is:
A)40.
B)45.
C)30.
D) 50.
Table 13.1
(Table 13.1) The choke wage is:
A)40.
B)45.
C)30.
D) 50.
Question
Use the following to answer questions 16-17:
Figure 13.3
(Figure 13.3) The figure shows budget constraints and indifference curves for a representative individual. Identify the income effect of the increase in the wage rate in the associated graph.
A) C to B
B) B to C
C) A to C
D) A to B
Figure 13.3
(Figure 13.3) The figure shows budget constraints and indifference curves for a representative individual. Identify the income effect of the increase in the wage rate in the associated graph.
A) C to B
B) B to C
C) A to C
D) A to B
Question
Question
Question
Question
Question
Use the following to answer questions 40-42:
Figure 13.5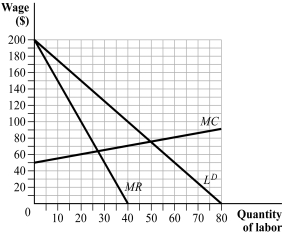
(Figure 13.5) The figure represents a labor union with wage in dollars and quantity of labor in hundreds of hours. If the labor union chooses to maximize profit, how many workers will it supply?
A) 2,750
B) 4,000
C) 5,000
D) 8,000
Figure 13.5
(Figure 13.5) The figure represents a labor union with wage in dollars and quantity of labor in hundreds of hours. If the labor union chooses to maximize profit, how many workers will it supply?
A) 2,750
B) 4,000
C) 5,000
D) 8,000
Question
Question
Use the following to answer questions 30-34:
Figure 13.4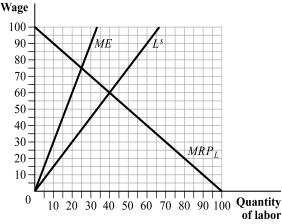
(Figure 13.4) The monopsony will hire _____ workers.
A) 100
B) 50
C) 25
D) 40
Figure 13.4
(Figure 13.4) The monopsony will hire _____ workers.
A) 100
B) 50
C) 25
D) 40
Question
Question
Use the following to answer questions 30-34:
Figure 13.4
(Figure 13.4) The monopsony will offer a wage of:
A) $52.50.
B) $60.
C) $75.
D) $37.50.
Figure 13.4
(Figure 13.4) The monopsony will offer a wage of:
A) $52.50.
B) $60.
C) $75.
D) $37.50.
Question
Use the following to answer questions 30-34:
Figure 13.4
(Figure 13.4) The deadweight loss associated with the monopsony equals:
A) $701.75.
B) $562.50.
C) $400.
D) $312.25.
Figure 13.4
(Figure 13.4) The deadweight loss associated with the monopsony equals:
A) $701.75.
B) $562.50.
C) $400.
D) $312.25.
Question
Use the following to answer questions 30-34:
Figure 13.4
(Figure 13.4) A price taker will choose to employ _____ workers.
A) 60
B) 50
C) 40
D) 25
Figure 13.4
(Figure 13.4) A price taker will choose to employ _____ workers.
A) 60
B) 50
C) 40
D) 25
Question
Question
Question
Question
Question
Question
Use the following to answer questions 30-34:
Figure 13.4
(Figure 13.4) The price taker will offer a wage of:
A) $100.
B) $50.
C) $40.
D) $60.
Figure 13.4
(Figure 13.4) The price taker will offer a wage of:
A) $100.
B) $50.
C) $40.
D) $60.
Question
Question
Question
Question
Question
Question
Question
Question
Question
Use the following to answer questions 40-42:
Figure 13.5
(Figure 13.5) The figure represents a labor union with wage in dollars and quantity of labor in hundreds of hours. If the labor union chooses to maximize total wages, how many workers will it supply?
A) 2,750
B) 4,000
C) 5,000
D) 8,000
Figure 13.5
(Figure 13.5) The figure represents a labor union with wage in dollars and quantity of labor in hundreds of hours. If the labor union chooses to maximize total wages, how many workers will it supply?
A) 2,750
B) 4,000
C) 5,000
D) 8,000
Question
Question
Use the following to answer question:
Table 13.4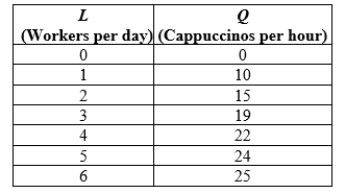
Table (13.4). Suppose that the wage rate for baristas is $9 per hour and the average price of cappuccino is $3.
a. Find the profit-maximizing quantity of labor.
b. What would be the new profit-maximizing quantity of labor if the market wage increased $12 per hour, ceteris paribus?
c. What would be the new profit-maximizing quantity of labor if the market wage remained at $9 per hour but the price of cappuccino increased to $4.50, ceteris paribus?
d. What would be the new profit-maximizing quantity of labor if the market wage remained at $9 per hour and the price of cappuccino at $3 but baristas all became 10% more productive because of an improvement in the way cappuccinos are made?
Question
Use the following to answer questions 43-44:
Figure 13.6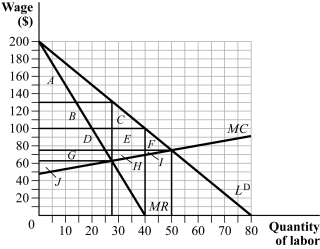
(Figure 13.6) The figure represents a labor union with wage in dollars and quantity of labor in hundreds of hours. If the labor union chooses to maximize profit, the deadweight loss will be:
A) C + E + F + H + I.
B) F + I.
C) C + E + F.
D) B + D + G.
Figure 13.6
(Figure 13.6) The figure represents a labor union with wage in dollars and quantity of labor in hundreds of hours. If the labor union chooses to maximize profit, the deadweight loss will be:
A) C + E + F + H + I.
B) F + I.
C) C + E + F.
D) B + D + G.
Question
Use the following to answer question:
Figure 13.7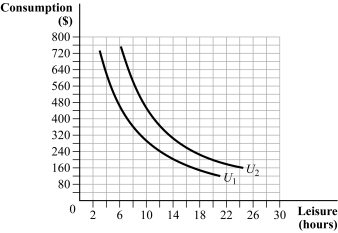
(Figure 13.7)
a. Graph a budget constraint assuming a person has 24 hours that can be used for work or leisure at a wage rate of $20. Note the optimal consumption-leisure bundle.
b. Graph a budget constraint assuming a person has 24 hours that can be used for work or leisure at a wage rate of $30. Note the optimal consumption-leisure bundle.
c. Determine both the income and substitution effects on the graph.
Question
Question
Question
Question
Question
Question
Question
Use the following to answer questions 43-44:
Figure 13.6
(Figure 13.6) The figure represents a labor union with wage in dollars and quantity of labor in hundreds of hours. If the labor union chooses to maximize total wages, the deadweight loss will be:
A) C + E + F + H + I.
B) F + I.
C) C + E + F.
D) B + D + G.
Figure 13.6
(Figure 13.6) The figure represents a labor union with wage in dollars and quantity of labor in hundreds of hours. If the labor union chooses to maximize total wages, the deadweight loss will be:
A) C + E + F + H + I.
B) F + I.
C) C + E + F.
D) B + D + G.
Question
Question
Use the following to answer questions 40-42:
Figure 13.5
(Figure 13.5) The figure represents a labor union with wage in dollars and quantity of labor in hundreds of hours. If the labor union chooses to maximize total wages, the equilibrium wage will be:
A) $75.
B) $63.
C) $100.
D) $130.
Figure 13.5
(Figure 13.5) The figure represents a labor union with wage in dollars and quantity of labor in hundreds of hours. If the labor union chooses to maximize total wages, the equilibrium wage will be:
A) $75.
B) $63.
C) $100.
D) $130.
Question
Use the following to answer question:
Table 13.5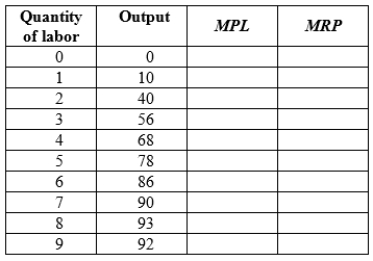
Table 13.5 shows the short-run production function for a competitive firm.
a. Complete the table, assuming the firm sells its output for $20 per unit.
b. How many workers will the firm hire at the market wage of $160 per day?
Table 13.5
Table 13.5 shows the short-run production function for a competitive firm.
a. Complete the table, assuming the firm sells its output for $20 per unit.
b. How many workers will the firm hire at the market wage of $160 per day?
Question
Question
Question
Question
Question
Use the following to answer question:
Figure 13.9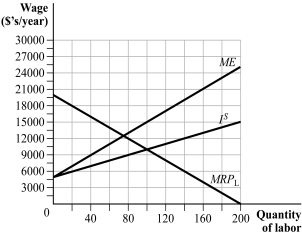
(Figure 13.9)
a. Determine the MRPL, lS, and ME equations.
b. Calculate and then illustrate the equilibrium outcome for the monopsonist.
c. Calculate and then illustrate the equilibrium outcome if the employer were a perfect competitor.
d. Complete the following table:
Figure 13.9
(Figure 13.9)
a. Determine the MRPL, lS, and ME equations.
b. Calculate and then illustrate the equilibrium outcome for the monopsonist.
c. Calculate and then illustrate the equilibrium outcome if the employer were a perfect competitor.
d. Complete the following table:
Question
Question
Use the following to answer question:
Table 13.3
(Table 13.3) Explain why a monopsony faces a marginal expenditure curve that lies above the supply curve. Each worker is named, for a total of four workers. All dollar values are given as dollars per hour.
Table 13.3
(Table 13.3) Explain why a monopsony faces a marginal expenditure curve that lies above the supply curve. Each worker is named, for a total of four workers. All dollar values are given as dollars per hour.
Question
Question
Question
Use the following to answer question:
Figure 13.10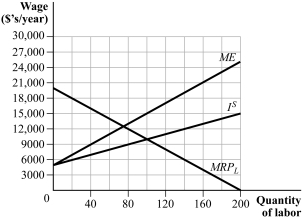
(Figure 13.10) Explain and graphically illustrate how the passage of a minimum wage would affect this market.
Figure 13.10
(Figure 13.10) Explain and graphically illustrate how the passage of a minimum wage would affect this market.

Unlock Deck
Sign up to unlock the cards in this deck!
Unlock Deck
Unlock Deck
1/70
Play
Full screen (f)
Deck 13: Factor Markets
1
Which of the following may affect a person's willingness to work?
A) age
B) health
C) family circumstances
D) All of the answers are correct.
A) age
B) health
C) family circumstances
D) All of the answers are correct.
D
2
Use the following to answer questions 13-15:
Figure 13.2
(Figure 13.2) If Louise was getting paid $20 per hour, then received a raise of $10 per hour, which graph would best illustrate her budget constraint?
A) (a)
B) (b)
C) (c)
D) (d)
Figure 13.2
(Figure 13.2) If Louise was getting paid $20 per hour, then received a raise of $10 per hour, which graph would best illustrate her budget constraint?
A) (a)
B) (b)
C) (c)
D) (d)
B
3
Use the following to answer questions 13-15:
Figure 13.2
(Figure 13.2) If Louise gets paid $20 per hour, which graph best illustrates her budget constraint?
A) (a)
B) (b)
C) (c)
D) (d)
Figure 13.2
(Figure 13.2) If Louise gets paid $20 per hour, which graph best illustrates her budget constraint?
A) (a)
B) (b)
C) (c)
D) (d)
A
4
Use the following to answer questions 8-11:
Figure 13.1
(Figure 13.1) Assume that the price per pound of apples has increased. Which graph best illustrates this change?
A) (a)
B) (b)
C) (c)
D) (d)
Figure 13.1
(Figure 13.1) Assume that the price per pound of apples has increased. Which graph best illustrates this change?
A) (a)
B) (b)
C) (c)
D) (d)
Unlock Deck
Unlock for access to all 70 flashcards in this deck.
Unlock Deck
k this deck
5
Use the following to answer questions 16-17:
Figure 13.3
(Figure 13.3) The figure shows budget constraints and indifference curves for a representative individual. Identify the substitution effect of the increase in the wage rate in the associated graph.
A) C to B
B) B to A
C) A to C
D) A to B
Figure 13.3
(Figure 13.3) The figure shows budget constraints and indifference curves for a representative individual. Identify the substitution effect of the increase in the wage rate in the associated graph.
A) C to B
B) B to A
C) A to C
D) A to B
Unlock Deck
Unlock for access to all 70 flashcards in this deck.
Unlock Deck
k this deck
6
Use the following to answer questions 5-7:
Table 13.1
(Table 13.1) The table shows the quantity of labor demanded at different wage rates. Which of the following statements is TRUE? I. When the market wage is $25 and the firm hires 7 workers, the benefit of hiring the seventh worker is greater than the costs of hiring the seventh worker.
II) When the market wage is $25 and the firm hires 4 workers, the benefit of hiring the fourth worker is less than the costs of hiring the fourth worker.
III) When the market wage is $25 and the firm hires 5 workers, the benefit of hiring the fifth worker on the margin equals the costs on the margin of hiring the fifth worker.
A) I
B) I and II
C) III
D) I and III
Unlock Deck
Unlock for access to all 70 flashcards in this deck.
Unlock Deck
k this deck
7
Use the following to answer questions 13-15:
Figure 13.2
(Figure 13.2) If Louise earns $20 per hour but can work only 4 hours per day, which graph best illustrates her budget constraint?
A) (a)
B) (b)
C) (c)
D) (d)
Figure 13.2
(Figure 13.2) If Louise earns $20 per hour but can work only 4 hours per day, which graph best illustrates her budget constraint?
A) (a)
B) (b)
C) (c)
D) (d)
Unlock Deck
Unlock for access to all 70 flashcards in this deck.
Unlock Deck
k this deck
8
Use the following to answer questions 19-20:
Table 13.2
(Table 13.2) The table shows the number of labor hours supplied per worker for various hourly wage rates. The correct market-level labor supply curve is:
A)
B)
C)
D)
Table 13.2
(Table 13.2) The table shows the number of labor hours supplied per worker for various hourly wage rates. The correct market-level labor supply curve is:
A)
B)
C)
D)
Unlock Deck
Unlock for access to all 70 flashcards in this deck.
Unlock Deck
k this deck
9
The marginal revenue product of labor is equal to:
A) MPK × MR.
B) MPL × MR.
C) MPL × W.
D) MPK × R.
A) MPK × MR.
B) MPL × MR.
C) MPL × W.
D) MPK × R.
Unlock Deck
Unlock for access to all 70 flashcards in this deck.
Unlock Deck
k this deck
10
Use the following to answer questions 8-11:
Figure 13.1
(Figure 13.1) Assume that the marginal productivity of apple pickers has increased. Which graph best illustrates this change?
A) (a)
B) (b)
C) (c)
D) (d)
Figure 13.1
(Figure 13.1) Assume that the marginal productivity of apple pickers has increased. Which graph best illustrates this change?
A) (a)
B) (b)
C) (c)
D) (d)
Unlock Deck
Unlock for access to all 70 flashcards in this deck.
Unlock Deck
k this deck
11
Compass Rose Landscaping operates in a very competitive market. It charges $80 per hour and pays the going market wage of $20 per hour to its workers. At its current level of employment, it has 3 workers, with the marginal product of the third worker equal to 5. Compass Rose should:
A) continue to use 3 workers.
B) hire more than 3 workers.
C) hire fewer workers.
D) the question cannot be answered with the information provided.
A) continue to use 3 workers.
B) hire more than 3 workers.
C) hire fewer workers.
D) the question cannot be answered with the information provided.
Unlock Deck
Unlock for access to all 70 flashcards in this deck.
Unlock Deck
k this deck
12
Use the following to answer questions 5-7:
Table 13.1
(Table 13.1) If the market wage is $25, the firm should hire _____ workers.
A) 5
B) 4
C) 3
D) 6
Table 13.1
(Table 13.1) If the market wage is $25, the firm should hire _____ workers.
A) 5
B) 4
C) 3
D) 6
Unlock Deck
Unlock for access to all 70 flashcards in this deck.
Unlock Deck
k this deck
13
For a given labor demand curve, which of the following is NOT held constant?
A) the price of the output
B) the production function
C) the productivity of labor
D) the price of labor
A) the price of the output
B) the production function
C) the productivity of labor
D) the price of labor
Unlock Deck
Unlock for access to all 70 flashcards in this deck.
Unlock Deck
k this deck
14
Use the following to answer questions 19-20:
Table 13.2
(Table 13.2) The table shows the number of labor hours supplied per worker for various hourly wage rates. The total amount of labor hours supplied at $20 per hour is:
A)20.
B)30.
C)90.
D) 100.
Table 13.2
(Table 13.2) The table shows the number of labor hours supplied per worker for various hourly wage rates. The total amount of labor hours supplied at $20 per hour is:
A)20.
B)30.
C)90.
D) 100.
Unlock Deck
Unlock for access to all 70 flashcards in this deck.
Unlock Deck
k this deck
15
If MRPL = W, then the firm:
A) should hire more labor.
B) should reduce the amount of labor it uses.
C) should not change the amount of labor it uses, since the amount is optimal now.
D) should reconsider how much capital it uses.
A) should hire more labor.
B) should reduce the amount of labor it uses.
C) should not change the amount of labor it uses, since the amount is optimal now.
D) should reconsider how much capital it uses.
Unlock Deck
Unlock for access to all 70 flashcards in this deck.
Unlock Deck
k this deck
16
Use the following to answer questions 8-11:
Figure 13.1
(Figure 13.1) There is a decrease in total factor productivity. Which graph best illustrates this change?
A) (a)
B) (b)
C) (c)
D) (d)
Figure 13.1
(Figure 13.1) There is a decrease in total factor productivity. Which graph best illustrates this change?
A) (a)
B) (b)
C) (c)
D) (d)
Unlock Deck
Unlock for access to all 70 flashcards in this deck.
Unlock Deck
k this deck
17
A backward-bending labor supply curve occurs when:
A) the substitution effect of a wage increase is greater than the income effect.
B) the income effect of a wage increase is greater than the substitution effect.
C) the substitution effect of a wage increase equals the income effect.
D) a negatively sloped labor supply curve is not possible.
A) the substitution effect of a wage increase is greater than the income effect.
B) the income effect of a wage increase is greater than the substitution effect.
C) the substitution effect of a wage increase equals the income effect.
D) a negatively sloped labor supply curve is not possible.
Unlock Deck
Unlock for access to all 70 flashcards in this deck.
Unlock Deck
k this deck
18
Use the following to answer questions 8-11:
Figure 13.1
(Figure 13.1) Assume that there is a decrease in the wage paid to apple pickers. Which graph best illustrates this change?
A) (a)
B) (b)
C) (c)
D) (d)
Figure 13.1
(Figure 13.1) Assume that there is a decrease in the wage paid to apple pickers. Which graph best illustrates this change?
A) (a)
B) (b)
C) (c)
D) (d)
Unlock Deck
Unlock for access to all 70 flashcards in this deck.
Unlock Deck
k this deck
19
Use the following to answer questions 5-7:
Table 13.1
(Table 13.1) The choke wage is:
A)40.
B)45.
C)30.
D) 50.
Table 13.1
(Table 13.1) The choke wage is:
A)40.
B)45.
C)30.
D) 50.
Unlock Deck
Unlock for access to all 70 flashcards in this deck.
Unlock Deck
k this deck
20
Use the following to answer questions 16-17:
Figure 13.3
(Figure 13.3) The figure shows budget constraints and indifference curves for a representative individual. Identify the income effect of the increase in the wage rate in the associated graph.
A) C to B
B) B to C
C) A to C
D) A to B
Figure 13.3
(Figure 13.3) The figure shows budget constraints and indifference curves for a representative individual. Identify the income effect of the increase in the wage rate in the associated graph.
A) C to B
B) B to C
C) A to C
D) A to B
Unlock Deck
Unlock for access to all 70 flashcards in this deck.
Unlock Deck
k this deck
21
The government offers subsidies to homeowners for the purchase and installation of solar energy generating equipment. Given that silicon (derived from silicate minerals) is the main input in the production of solar panels, how will the subsidy affect the market for silicon?
A) Demand will rise, leading to an increase in the equilibrium price and quantity of silicon.
B) Supply will rise, leading to an increase in the equilibrium quantity and decrease in price.
C) Demand will fall, leading to a decrease in the equilibrium price and quantity.
D) Supply will fall, leading to an increase in the equilibrium price and decrease in the quantity.
Unlock Deck
Unlock for access to all 70 flashcards in this deck.
Unlock Deck
k this deck
22
In the market for unimproved land, supply would best be described as:
A) elastic.
B) inelastic.
C) perfectly elastic.
D) perfectly inelastic.
A) elastic.
B) inelastic.
C) perfectly elastic.
D) perfectly inelastic.
Unlock Deck
Unlock for access to all 70 flashcards in this deck.
Unlock Deck
k this deck
23
In the long run, a firm's decision about hiring labor is _____ compared to the short run.
A) less responsive
B) equally responsive
C) more responsive
D) unresponsive
A) less responsive
B) equally responsive
C) more responsive
D) unresponsive
Unlock Deck
Unlock for access to all 70 flashcards in this deck.
Unlock Deck
k this deck
24
Assume there is a decrease in the demand for soda, some of which comes in aluminum cans. In the market for bauxite, the main mineral source of aluminum, the equilibrium price would _____ and the equilibrium quantity would _____.
A) rise; fall
B) fall; fall
C) rise; rise
D) fall, rise
A) rise; fall
B) fall; fall
C) rise; rise
D) fall, rise
Unlock Deck
Unlock for access to all 70 flashcards in this deck.
Unlock Deck
k this deck
25
Use the following to answer questions 40-42:
Figure 13.5
(Figure 13.5) The figure represents a labor union with wage in dollars and quantity of labor in hundreds of hours. If the labor union chooses to maximize profit, how many workers will it supply?
A) 2,750
B) 4,000
C) 5,000
D) 8,000
Figure 13.5
(Figure 13.5) The figure represents a labor union with wage in dollars and quantity of labor in hundreds of hours. If the labor union chooses to maximize profit, how many workers will it supply?
A) 2,750
B) 4,000
C) 5,000
D) 8,000
Unlock Deck
Unlock for access to all 70 flashcards in this deck.
Unlock Deck
k this deck
26
Which of the following is NOT a goal of a labor union?
A) profit maximization
B) job security
C) the competitive market wage
D) total wage maximization
A) profit maximization
B) job security
C) the competitive market wage
D) total wage maximization
Unlock Deck
Unlock for access to all 70 flashcards in this deck.
Unlock Deck
k this deck
27
Use the following to answer questions 30-34:
Figure 13.4
(Figure 13.4) The monopsony will hire _____ workers.
A) 100
B) 50
C) 25
D) 40
Figure 13.4
(Figure 13.4) The monopsony will hire _____ workers.
A) 100
B) 50
C) 25
D) 40
Unlock Deck
Unlock for access to all 70 flashcards in this deck.
Unlock Deck
k this deck
28
A monopsony has a marginal revenue product curve of MRPL = 100 - l and faces a labor supply curve of W = 1.5l. How many workers will the price taker hire?
A) 100
B) 50
C) 25
D) 40
A) 100
B) 50
C) 25
D) 40
Unlock Deck
Unlock for access to all 70 flashcards in this deck.
Unlock Deck
k this deck
29
Use the following to answer questions 30-34:
Figure 13.4
(Figure 13.4) The monopsony will offer a wage of:
A) $52.50.
B) $60.
C) $75.
D) $37.50.
Figure 13.4
(Figure 13.4) The monopsony will offer a wage of:
A) $52.50.
B) $60.
C) $75.
D) $37.50.
Unlock Deck
Unlock for access to all 70 flashcards in this deck.
Unlock Deck
k this deck
30
Use the following to answer questions 30-34:
Figure 13.4
(Figure 13.4) The deadweight loss associated with the monopsony equals:
A) $701.75.
B) $562.50.
C) $400.
D) $312.25.
Figure 13.4
(Figure 13.4) The deadweight loss associated with the monopsony equals:
A) $701.75.
B) $562.50.
C) $400.
D) $312.25.
Unlock Deck
Unlock for access to all 70 flashcards in this deck.
Unlock Deck
k this deck
31
Use the following to answer questions 30-34:
Figure 13.4
(Figure 13.4) A price taker will choose to employ _____ workers.
A) 60
B) 50
C) 40
D) 25
Figure 13.4
(Figure 13.4) A price taker will choose to employ _____ workers.
A) 60
B) 50
C) 40
D) 25
Unlock Deck
Unlock for access to all 70 flashcards in this deck.
Unlock Deck
k this deck
32
If the marginal expenditure for a monopsony is $75 and it is paying a wage of $50, the elasticity of labor supply is:
A) 0.5.
B)2)
C)0)
D) 1.
A) 0.5.
B)2)
C)0)
D) 1.
Unlock Deck
Unlock for access to all 70 flashcards in this deck.
Unlock Deck
k this deck
33
If a monopsony faces an elasticity of labor supply of 3 and a marginal expenditure of $120, it will offer a wage of:
A)100.
B)50.
C)25.
D) 40.
A)100.
B)50.
C)25.
D) 40.
Unlock Deck
Unlock for access to all 70 flashcards in this deck.
Unlock Deck
k this deck
34
Assume that there has been an increase in the marginal productivity of construction workers building new housing. How might this affect the market for new housing?
A) Demand for new housing will rise, leading to an increase in the equilibrium price and quantity of new housing.
B) Supply of new housing will rise, leading to an increase in the equilibrium quantity and decrease in the price of new housing.
C) Demand for new housing will fall, leading to a decrease in the equilibrium price and quantity of new housing.
D) Supply of new housing will fall, leading to an increase in the equilibrium price and decrease in the quantity of new housing.
Unlock Deck
Unlock for access to all 70 flashcards in this deck.
Unlock Deck
k this deck
35
A monopsony has a marginal revenue product curve of MRPL = 100 - l and faces a labor supply curve of W = 1.5l. How many workers will the monopsony hire?
A) 100
B) 50
C) 25
D) 40
A) 100
B) 50
C) 25
D) 40
Unlock Deck
Unlock for access to all 70 flashcards in this deck.
Unlock Deck
k this deck
36
A labor market monopsony faces a(n):
A) horizontal labor supply curve.
B) vertical labor supply curve.
C) upward-sloping labor supply curve.
D) downward-sloping labor supply curve.
A) horizontal labor supply curve.
B) vertical labor supply curve.
C) upward-sloping labor supply curve.
D) downward-sloping labor supply curve.
Unlock Deck
Unlock for access to all 70 flashcards in this deck.
Unlock Deck
k this deck
37
Use the following to answer questions 30-34:
Figure 13.4
(Figure 13.4) The price taker will offer a wage of:
A) $100.
B) $50.
C) $40.
D) $60.
Figure 13.4
(Figure 13.4) The price taker will offer a wage of:
A) $100.
B) $50.
C) $40.
D) $60.
Unlock Deck
Unlock for access to all 70 flashcards in this deck.
Unlock Deck
k this deck
38
Assume that the labor market is in equilibrium. An increase in the availability of public transportation would shift labor _____, _____ the equilibrium wage and _____ the amount of labor employed.
A) demand to the right, increasing; increasing
B) supply to the right, decreasing; increasing
C) demand to the left, decreasing; decreasing
D) supply to the left, increasing; decreasing
A) demand to the right, increasing; increasing
B) supply to the right, decreasing; increasing
C) demand to the left, decreasing; decreasing
D) supply to the left, increasing; decreasing
Unlock Deck
Unlock for access to all 70 flashcards in this deck.
Unlock Deck
k this deck
39
When examining the labor market in the short run, which of the following is assumed to be constant?
A) marginal productivity of labor
B) quantity of capital
C) the wage rate
D) labor supply
A) marginal productivity of labor
B) quantity of capital
C) the wage rate
D) labor supply
Unlock Deck
Unlock for access to all 70 flashcards in this deck.
Unlock Deck
k this deck
40
Assume that the labor market for house painters is in equilibrium. An increase in the price of painting a house would:
A) shift labor demand to the right, increasing the equilibrium wage and number of painters employed.
B) shift labor supply to the right, decreasing the equilibrium wage and increasing the number of painters employed.
C) shift labor demand to the left, decreasing the equilibrium wage and number of painters employed.
D) shift labor supply to the left, increasing the equilibrium wage and decreasing the number of painters employed.
Unlock Deck
Unlock for access to all 70 flashcards in this deck.
Unlock Deck
k this deck
41
A pizza shop's marginal product of labor, measured as the number of pizzas delivered per week, is MPL = 55 - 5L, where L is the number of workers. The average price of a pizza in this highly competitive market is $10. The shop can hire workers at the market wage of $300 per week.
a. What is the marginal product of labor for the second worker?
b. Does the law of diminishing marginal productivity apply in this scenario? If so, at what quantity level does it occur?
c. How many workers will the pizza shop hire?
a. What is the marginal product of labor for the second worker?
b. Does the law of diminishing marginal productivity apply in this scenario? If so, at what quantity level does it occur?
c. How many workers will the pizza shop hire?
Unlock Deck
Unlock for access to all 70 flashcards in this deck.
Unlock Deck
k this deck
42
Suppose the demand faced by a labor monopsony is W = 20,000 - 50l, where W is the annual wage and l is the number of workers hired. The labor supply is given by W = 5,000 + 75l. What is the deadweight loss associated with this monopsony, rounded to the nearest dollar?
A) $105,502
B) $120,356
C) $126,563
D) $130,000
A) $105,502
B) $120,356
C) $126,563
D) $130,000
Unlock Deck
Unlock for access to all 70 flashcards in this deck.
Unlock Deck
k this deck
43
Rebecca, a student, can work or enjoy leisure for 16 hours a day. (Assume she sleeps 8 hours a day.)
a. On a graph, construct Rebecca's budget constraint if she earns $10 per hour. Label is BC1.
b. On the same graph, construct Rebecca's budget constraint if she earns $15 per hour. Label is BC2.
c. On the same graph, construct Rebecca's budget constraint if she earns $10 per hour but receives the equivalent of $50 per day from her parents. Label is BC3.
Unlock Deck
Unlock for access to all 70 flashcards in this deck.
Unlock Deck
k this deck
44
Suppose the demand faced by a labor monopsony is W = 20,000 - 50l, where W is the annual wage and l is the number of workers hired. The labor supply is given by W = 5,000 + 75l. How many workers will the firm hire?
A) 50
B) 75
C) 60
D) 80
A) 50
B) 75
C) 60
D) 80
Unlock Deck
Unlock for access to all 70 flashcards in this deck.
Unlock Deck
k this deck
45
Use an example to explain why labor demand is considered a derived demand.
Unlock Deck
Unlock for access to all 70 flashcards in this deck.
Unlock Deck
k this deck
46
Use the following to answer questions 40-42:
Figure 13.5
(Figure 13.5) The figure represents a labor union with wage in dollars and quantity of labor in hundreds of hours. If the labor union chooses to maximize total wages, how many workers will it supply?
A) 2,750
B) 4,000
C) 5,000
D) 8,000
Figure 13.5
(Figure 13.5) The figure represents a labor union with wage in dollars and quantity of labor in hundreds of hours. If the labor union chooses to maximize total wages, how many workers will it supply?
A) 2,750
B) 4,000
C) 5,000
D) 8,000
Unlock Deck
Unlock for access to all 70 flashcards in this deck.
Unlock Deck
k this deck
47
Use your understanding of marginal revenue product of labor, along with the appropriate graph, to explain one reason the average salary of National Football League players is higher than the average salary of college professors.
Unlock Deck
Unlock for access to all 70 flashcards in this deck.
Unlock Deck
k this deck
48
Use the following to answer question:
Table 13.4
Table (13.4). Suppose that the wage rate for baristas is $9 per hour and the average price of cappuccino is $3.
a. Find the profit-maximizing quantity of labor.
b. What would be the new profit-maximizing quantity of labor if the market wage increased $12 per hour, ceteris paribus?
c. What would be the new profit-maximizing quantity of labor if the market wage remained at $9 per hour but the price of cappuccino increased to $4.50, ceteris paribus?
d. What would be the new profit-maximizing quantity of labor if the market wage remained at $9 per hour and the price of cappuccino at $3 but baristas all became 10% more productive because of an improvement in the way cappuccinos are made?
Unlock Deck
Unlock for access to all 70 flashcards in this deck.
Unlock Deck
k this deck
49
Use the following to answer questions 43-44:
Figure 13.6
(Figure 13.6) The figure represents a labor union with wage in dollars and quantity of labor in hundreds of hours. If the labor union chooses to maximize profit, the deadweight loss will be:
A) C + E + F + H + I.
B) F + I.
C) C + E + F.
D) B + D + G.
Figure 13.6
(Figure 13.6) The figure represents a labor union with wage in dollars and quantity of labor in hundreds of hours. If the labor union chooses to maximize profit, the deadweight loss will be:
A) C + E + F + H + I.
B) F + I.
C) C + E + F.
D) B + D + G.
Unlock Deck
Unlock for access to all 70 flashcards in this deck.
Unlock Deck
k this deck
50
Use the following to answer question:
Figure 13.7
(Figure 13.7)
a. Graph a budget constraint assuming a person has 24 hours that can be used for work or leisure at a wage rate of $20. Note the optimal consumption-leisure bundle.
b. Graph a budget constraint assuming a person has 24 hours that can be used for work or leisure at a wage rate of $30. Note the optimal consumption-leisure bundle.
c. Determine both the income and substitution effects on the graph.
Unlock Deck
Unlock for access to all 70 flashcards in this deck.
Unlock Deck
k this deck
51
A firm sells bagels for 50 cents each. With 10 workers the firm produces 100 dozen per hour, and with 12 workers it produces 123 dozen per hour. If the firm has 12 workers at the competitive equilibrium, what is the marginal revenue product of labor and the market wage rate, assuming an average 8-hour shift per worker?
Unlock Deck
Unlock for access to all 70 flashcards in this deck.
Unlock Deck
k this deck
52
On a graph, draw an indifference curve for a workaholic versus a laid-back person. Comment on their respective marginal rates of substitution between leisure and consumption.
Unlock Deck
Unlock for access to all 70 flashcards in this deck.
Unlock Deck
k this deck
53
If the marginal cost of labor curve lies above the labor supply curve, the firm is likely a(n):
A) monopsony.
B) bilateral monopoly.
C) oligopoly.
D) monopoly.
A) monopsony.
B) bilateral monopoly.
C) oligopoly.
D) monopoly.
Unlock Deck
Unlock for access to all 70 flashcards in this deck.
Unlock Deck
k this deck
54
The marginal product of labor curve for Coast to Coast, a standup paddle board outfitter, is MRPL = 500 -100L, where L is the number of guides hired per week and MRPL is dollars earned per guide per week. The prevailing market wage is $200 per week.
a. Graph both the MRPL and the prevailing market wage in the grid provided.
b. What is the choke wage for Coast to Coast?
c. What will be the optimal amount of labor for Coast to Coast to hire?
a. Graph both the MRPL and the prevailing market wage in the grid provided.
b. What is the choke wage for Coast to Coast?
c. What will be the optimal amount of labor for Coast to Coast to hire?
Unlock Deck
Unlock for access to all 70 flashcards in this deck.
Unlock Deck
k this deck
55
Which of the following statement(s) is (are) true? I. A labor union can choose to maximize profit, maximize total wages of its members, or accept the competitive wage.
II) The number of workers employed when a union is present is generally greater than the number employed in a perfectly competitive labor market.
III) The wage rate paid to union workers typically exceeds that of workers in a competitive market.
A) I, II, and III
B) III
C) I and III
D) II and III
II) The number of workers employed when a union is present is generally greater than the number employed in a perfectly competitive labor market.
III) The wage rate paid to union workers typically exceeds that of workers in a competitive market.
A) I, II, and III
B) III
C) I and III
D) II and III
Unlock Deck
Unlock for access to all 70 flashcards in this deck.
Unlock Deck
k this deck
56
Suppose the demand faced by a labor monopsony is W = 20,000 - 50l, where W is the annual wage and l is the number of workers hired. The labor supply is given by W = 5,000 + 75l. The monopsony will pay a wage equal to:
A) $14,000.
B) $10,625.
C) $16,250.
D) $20,000.
A) $14,000.
B) $10,625.
C) $16,250.
D) $20,000.
Unlock Deck
Unlock for access to all 70 flashcards in this deck.
Unlock Deck
k this deck
57
Use the following to answer questions 43-44:
Figure 13.6
(Figure 13.6) The figure represents a labor union with wage in dollars and quantity of labor in hundreds of hours. If the labor union chooses to maximize total wages, the deadweight loss will be:
A) C + E + F + H + I.
B) F + I.
C) C + E + F.
D) B + D + G.
Figure 13.6
(Figure 13.6) The figure represents a labor union with wage in dollars and quantity of labor in hundreds of hours. If the labor union chooses to maximize total wages, the deadweight loss will be:
A) C + E + F + H + I.
B) F + I.
C) C + E + F.
D) B + D + G.
Unlock Deck
Unlock for access to all 70 flashcards in this deck.
Unlock Deck
k this deck
58
If the labor supply curve faced by a monopsony is given by l = -800 + 50W, then the correct marginal expenditure curve will be:
A) l = -800 + 100W.
B) W = 16 - 0.02l.
C) l = -800 + 25W.
D) W = 16 - 0.04l.
A) l = -800 + 100W.
B) W = 16 - 0.02l.
C) l = -800 + 25W.
D) W = 16 - 0.04l.
Unlock Deck
Unlock for access to all 70 flashcards in this deck.
Unlock Deck
k this deck
59
Use the following to answer questions 40-42:
Figure 13.5
(Figure 13.5) The figure represents a labor union with wage in dollars and quantity of labor in hundreds of hours. If the labor union chooses to maximize total wages, the equilibrium wage will be:
A) $75.
B) $63.
C) $100.
D) $130.
Figure 13.5
(Figure 13.5) The figure represents a labor union with wage in dollars and quantity of labor in hundreds of hours. If the labor union chooses to maximize total wages, the equilibrium wage will be:
A) $75.
B) $63.
C) $100.
D) $130.
Unlock Deck
Unlock for access to all 70 flashcards in this deck.
Unlock Deck
k this deck
60
Use the following to answer question:
Table 13.5
Table 13.5 shows the short-run production function for a competitive firm.
a. Complete the table, assuming the firm sells its output for $20 per unit.
b. How many workers will the firm hire at the market wage of $160 per day?
Table 13.5
Table 13.5 shows the short-run production function for a competitive firm.
a. Complete the table, assuming the firm sells its output for $20 per unit.
b. How many workers will the firm hire at the market wage of $160 per day?
Unlock Deck
Unlock for access to all 70 flashcards in this deck.
Unlock Deck
k this deck
61
Suppose the demand faced by a labor monopsony is W = 40,000 - 100l, where W is the annual wage and L is the number of workers hired. The labor supply is given by W = 10,000 + 100l.
a. Derive the marginal expenditure equation.
b. Determine the wage the monopsonist would pay and how many workers it would hire.
a. Derive the marginal expenditure equation.
b. Determine the wage the monopsonist would pay and how many workers it would hire.
Unlock Deck
Unlock for access to all 70 flashcards in this deck.
Unlock Deck
k this deck
62
A pizza shop's marginal product of labor, measured as the number of pizzas delivered per week, is MPl = 55 - 5L, where L is the number of workers. The current average price of a pizza in this highly competitive market is $10. The shop, a monopsonist, faces labor supply of W = 100 + 40l, where W is the wage per week and L is the number of workers.
a. How many workers will the pizza shop hire when the price of pizza is $10?
b. An influx of college students coming back from vacation raises the market price of a pizza to $15. How many workers will the pizza shop hire when the price of pizza is $15?
a. How many workers will the pizza shop hire when the price of pizza is $10?
b. An influx of college students coming back from vacation raises the market price of a pizza to $15. How many workers will the pizza shop hire when the price of pizza is $15?
Unlock Deck
Unlock for access to all 70 flashcards in this deck.
Unlock Deck
k this deck
63
At many colleges and universities, adjunct (part-time) faculty do not belong to a union. Explain what would happen to faculty wages and employment at a university if the adjunct faculties successfully unionized.
Unlock Deck
Unlock for access to all 70 flashcards in this deck.
Unlock Deck
k this deck
64
Explain how the following would affect the equilibrium wage and quantity of labor in the labor market.
a. A decrease in the price of the output made by labor
b. An increase in legal immigration
c. An increase in the amount of capital used by firms
a. A decrease in the price of the output made by labor
b. An increase in legal immigration
c. An increase in the amount of capital used by firms
Unlock Deck
Unlock for access to all 70 flashcards in this deck.
Unlock Deck
k this deck
65
Use the following to answer question:
Figure 13.9
(Figure 13.9)
a. Determine the MRPL, lS, and ME equations.
b. Calculate and then illustrate the equilibrium outcome for the monopsonist.
c. Calculate and then illustrate the equilibrium outcome if the employer were a perfect competitor.
d. Complete the following table:
Figure 13.9
(Figure 13.9)
a. Determine the MRPL, lS, and ME equations.
b. Calculate and then illustrate the equilibrium outcome for the monopsonist.
c. Calculate and then illustrate the equilibrium outcome if the employer were a perfect competitor.
d. Complete the following table:
Unlock Deck
Unlock for access to all 70 flashcards in this deck.
Unlock Deck
k this deck
66
Explain how a union is similar to a cartel.
Unlock Deck
Unlock for access to all 70 flashcards in this deck.
Unlock Deck
k this deck
67
Use the following to answer question:
Table 13.3
(Table 13.3) Explain why a monopsony faces a marginal expenditure curve that lies above the supply curve. Each worker is named, for a total of four workers. All dollar values are given as dollars per hour.
Table 13.3
(Table 13.3) Explain why a monopsony faces a marginal expenditure curve that lies above the supply curve. Each worker is named, for a total of four workers. All dollar values are given as dollars per hour.
Unlock Deck
Unlock for access to all 70 flashcards in this deck.
Unlock Deck
k this deck
68
A union faces a labor demand curve given by MRPL = 100 - 5L. If the union wishes to maximize the total wages of its membership, how many members will be employed and what will be the average wage?
Unlock Deck
Unlock for access to all 70 flashcards in this deck.
Unlock Deck
k this deck
69
Assume that the initial short-run labor demand curve is given by MRPL1 = 800 - 50l, where l is the quantity of labor demanded. The market wage rate is $200 per week. Graphically explain why long-run labor demand is flatter than short-run labor demand.
Unlock Deck
Unlock for access to all 70 flashcards in this deck.
Unlock Deck
k this deck
70
Use the following to answer question:
Figure 13.10
(Figure 13.10) Explain and graphically illustrate how the passage of a minimum wage would affect this market.
Figure 13.10
(Figure 13.10) Explain and graphically illustrate how the passage of a minimum wage would affect this market.
Unlock Deck
Unlock for access to all 70 flashcards in this deck.
Unlock Deck
k this deck
Unlock Deck
Unlock for access to all 70 flashcards in this deck.


