Deck 3: Functions Given by Graphs
Full screen (f)
Question
Question
Below is a graph of a function  .Over what region(s) is the function decreasing?
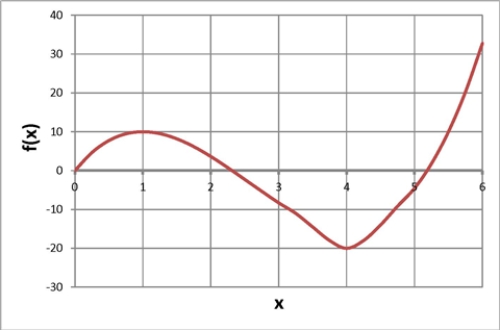
A) from 0 to 1 and from 4 to 6
B) from 1 to 4
C) from -20 to 10
D) None of the above
.Over what region(s) is the function decreasing?
A) from 0 to 1 and from 4 to 6
B) from 1 to 4
C) from -20 to 10
D) None of the above
Question
You put a drink in the freezer to cool.You take it out of the freezer when it is cold.But you forget about the drink and leave it sitting on the kitchen counter.The graph below shows the temperature, in degrees, of the drink t minutes after the drink is placed in the freezer.What is the temperature in the kitchen?
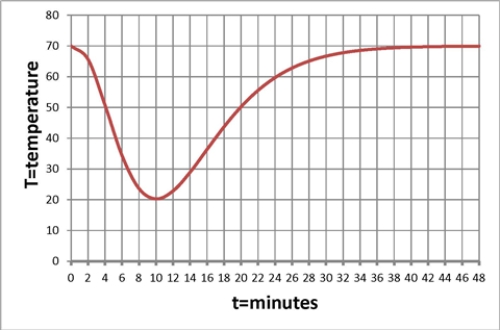
A) 20 degrees
B) 60 degrees
C) 70 degrees
D) None of the above
A) 20 degrees
B) 60 degrees
C) 70 degrees
D) None of the above
Question
Question
Question
Below is a graph of a function  .Find the value of
  .
. 
A) 8
B) 2
C) 15.20
D) None of the above
.Find the value of .
A) 8
B) 2
C) 15.20
D) None of the above
Question
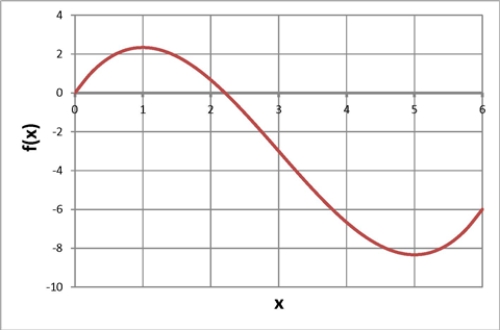
Below is a graph of a function  .Find the average rate of change in f from 1 to 3 .
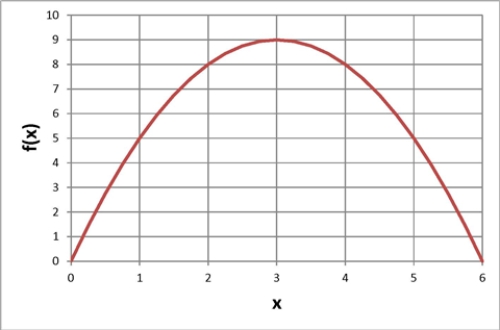
A) 3
B) 2
C) 4
D) None of the above
.Find the average rate of change in f from 1 to 3 .
A) 3
B) 2
C) 4
D) None of the above
Question
Question
Below is a graph of a function  .Find the average rate of change in f from 4 to 10 .
A) 20
B) -5
C) -30
D) None of the above
.Find the average rate of change in f from 4 to 10 .
A) 20
B) -5
C) -30
D) None of the above
Question
Below is a graph of a function  .Over what region(s) is the function increasing?
A) from 3 to 6
B) from 0 to 3
C) at
D) None of the above
.Over what region(s) is the function increasing?
A) from 3 to 6
B) from 0 to 3
C) at
D) None of the above
Question
Below is a graph of a function  .What is the value of
  ?
? 
A) 5
B) -5
C) 8
D) None of the above
.What is the value of ?
A) 5
B) -5
C) 8
D) None of the above
Question
Question
Below is a graph of a function  .Find the largest value of x so that
  .
. 
A) 3
B) 2
C) 4
D) None of the above
.Find the largest value of x so that .
A) 3
B) 2
C) 4
D) None of the above
Question
Below is a graph of a function  .Over what region(s) is the graph concave up?
A) at
B) from 0 to 3
C) from 3 to 6
D) None of the above
.Over what region(s) is the graph concave up?
A) at
B) from 0 to 3
C) from 3 to 6
D) None of the above
Question
Below is a graph of a function  .At what value of x does f reach its maximum value, and what is that value?
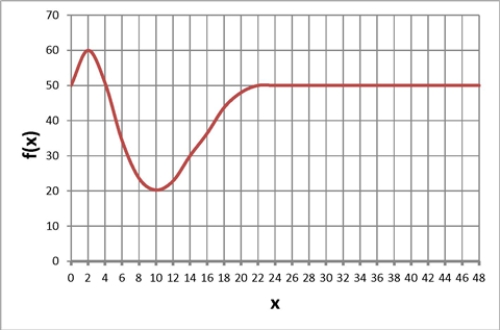
A) 50.00
B) maximum of 60 at
C) maximum of 2 at
D) None of the above
.At what value of x does f reach its maximum value, and what is that value?
A) 50.00
B) maximum of 60 at
C) maximum of 2 at
D) None of the above
Question
Question
Below is a graph of a function  .What is the limiting value for f?
A) 60
B) 20
C) 50
D) None of the above
.What is the limiting value for f? A) 60
B) 20
C) 50
D) None of the above
Question
Question
Question
Below is a graph of a function  .Find the value of
  .
. 
A) 10
B) 20.00
C) 50
D) None of the above
.Find the value of .
A) 10
B) 20.00
C) 50
D) None of the above
Question
The graph below shows the numbers, in thousands, of men and women of a given height in a population.What are the most common heights for men and for women? 
A) The most common height for both men and women is about 170 centimeters.
B) The most common height for women is about 160 centimeters, and the most common height for men is about 177 centimeters.
C) The most common height for men is about 110 centimeters, and the most common height for women is about 120 centimeters.
D) None of the above.
Question
The graph below shows the atmospheric pressure P, in millibars of mercury, as a function of altitude A in meters.According to the graph, what is the approximate value of the solution for A of the equation  ?
? 
A) meters
B) meters
C) meters.
D) The equation has no solution.
?
A)
metersB)
metersC)
meters.D) The equation has no solution.
Question
Which of the following stories best fits the graph below? 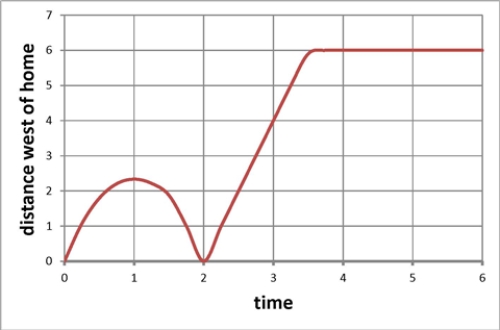
A) I left home walking to class but forgot my book.I went back home for the book and then went to math class.
B) I left home and went to math class.After class I returned home.
C) I left English class, walked home for lunch, then went to math class.
D) I went from English class to math class.After math I walked home.
Question
Which of the following stories best fits the graph below? 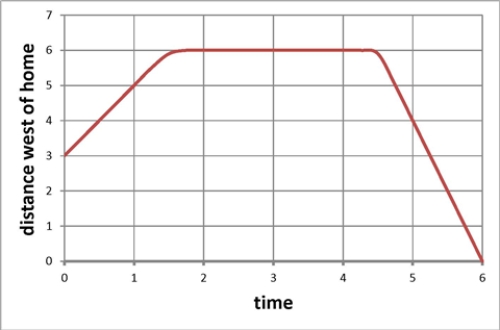
A) I left home walking to class but forgot my book.I went back home for the book and then went to math class.
B) I left home and went to math class.After class I returned home.
C) I left English class, walked home for lunch, then went to math class.
D) I went from English class to math class.After math I walked home.
A) I left home walking to class but forgot my book.I went back home for the book and then went to math class.
B) I left home and went to math class.After class I returned home.
C) I left English class, walked home for lunch, then went to math class.
D) I went from English class to math class.After math I walked home.
Question
The graph below shows the fundraising  of the Republican National Committee, in millions of dollars, as a function of the date.The graph indicates that there are two solutions d of the equation
  million.What two dates (approximately) correspond to these solutions?
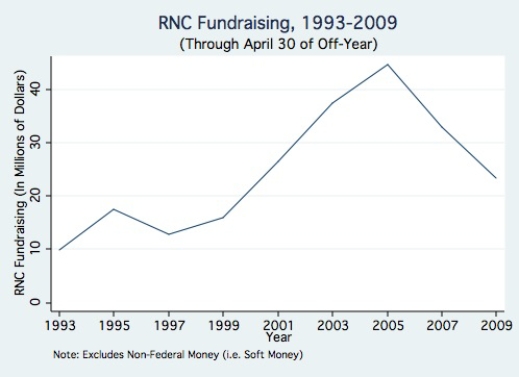
A) About 2001 and 2009.
B) About 1995 and 2005
C) About 1993 and 2009
D) There is no solution.
of the Republican National Committee, in millions of dollars, as a function of the date.The graph indicates that there are two solutions d of the equation million.What two dates (approximately) correspond to these solutions? A) About 2001 and 2009.
B) About 1995 and 2005
C) About 1993 and 2009
D) There is no solution.
Question
The graph below shows the value, in dollars, of a foreign currency t years after 2000. For what two dates between 2000 and 2020 would earn you the most money if you bought the foreign currency on the first date and sold on the second?

A) Buy in 2002 and sell in 2008
B) Buy in 2008 and sell the same year
C) Buy in 2005 and sell in 2008
D) None of the above
A) Buy in 2002 and sell in 2008
B) Buy in 2008 and sell the same year
C) Buy in 2005 and sell in 2008
D) None of the above
Question
Which of the following stories best fits the graph below? 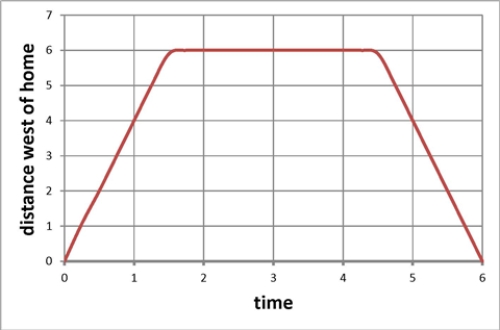
A) I left home walking to class but forgot my book.I went back home for the book and then went to math class.
B) I left home and went to math class.After class I returned home.
C) I left English class, walked home for lunch, then went to math class.
D) I went from English class to math class.After math I walked home.
A) I left home walking to class but forgot my book.I went back home for the book and then went to math class.
B) I left home and went to math class.After class I returned home.
C) I left English class, walked home for lunch, then went to math class.
D) I went from English class to math class.After math I walked home.
Question
The graph below shows the maximum angle above the horizon reached by the moon during the month of June.On what day does the smallest maximum angle occur, and what is that angle? 
A) The smallest maximum angle of about 71 degrees occurs on June 29.
B) The smallest maximum angle occurs at the time of the new moon.
C) The smallest maximum angle of about 22 degrees occurs on June 15.
D) The smallest maximum angle of about 71 degrees occurs on June 2.
A) The smallest maximum angle of about 71 degrees occurs on June 29.
B) The smallest maximum angle occurs at the time of the new moon.
C) The smallest maximum angle of about 22 degrees occurs on June 15.
D) The smallest maximum angle of about 71 degrees occurs on June 2.
Question
The graph below shows the blood-glucose levels, in milligrams per deciliter, as a function of hours since a meal was ingested.The three graphs are for a healthy person (labeled normal), a prediabetic, and a diabetic person.The graph indicates that regardless of diabetic condition, blood-glucose reaches a maximum concentration about how many hours after eating?
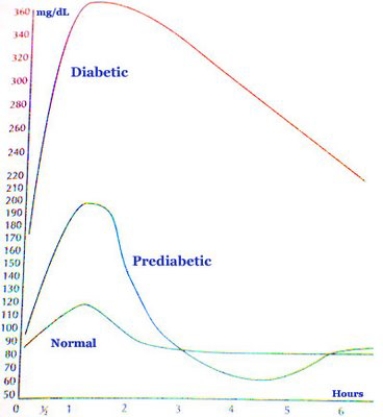
A) About 110 milligrams per deciliter
B) About 70 milligrams per deciliter
C) About 1 hour after eating
D) About 4.5 hours after eating
A) About 110 milligrams per deciliter
B) About 70 milligrams per deciliter
C) About 1 hour after eating
D) About 4.5 hours after eating
Question
The graph below shows the value, in dollars, of a foreign currency t years after 2000. In what year from 2000 to 2020 did the value of the foreign currency reach its maximum, and what was that maximum value?
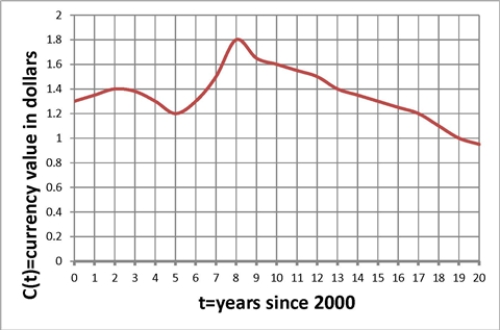
A) The maximum value of $1.80 occurred in 2008.
B) The maximum value of $1.20 occurred in 2005.
C) The maximum value of $1.40 occurred in 2002.
D) The maximum value of $0.90 occurred in 2020.
A) The maximum value of $1.80 occurred in 2008.
B) The maximum value of $1.20 occurred in 2005.
C) The maximum value of $1.40 occurred in 2002.
D) The maximum value of $0.90 occurred in 2020.
Question
The graph below shows the numbers, in thousands, of men and women of a given height in a population.This graph allows us to conclude that: 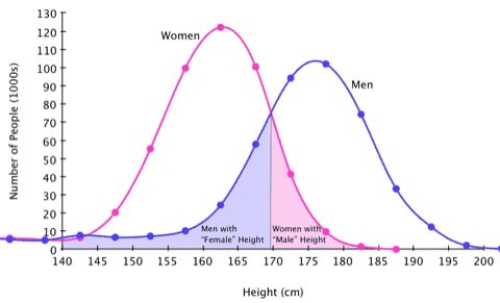
A) Women are taller than men.
B) The most common height for women is about 160 centimeters.
C) The most common height for men is about 170 centimeters.
D) There are fewer tall men than tall women.
A) Women are taller than men.
B) The most common height for women is about 160 centimeters.
C) The most common height for men is about 170 centimeters.
D) There are fewer tall men than tall women.
Question
Below is a graph of a function  .At what value of x does the point of inflection occur?
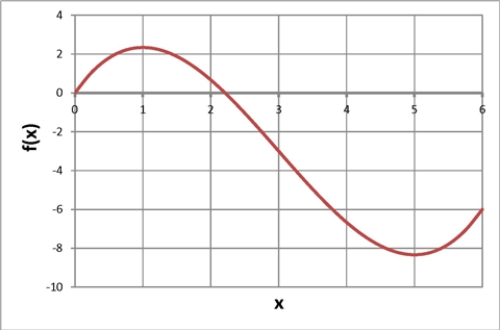
A) at
B) at
C) at
D) None of the above
.At what value of x does the point of inflection occur?
A) at
B) at
C) at
D) None of the above
Question
The graph below shows the maximum angle above the horizon reached by the moon during the month of June.What was the average rate of change in the maximum angle from June 8 to June 14? 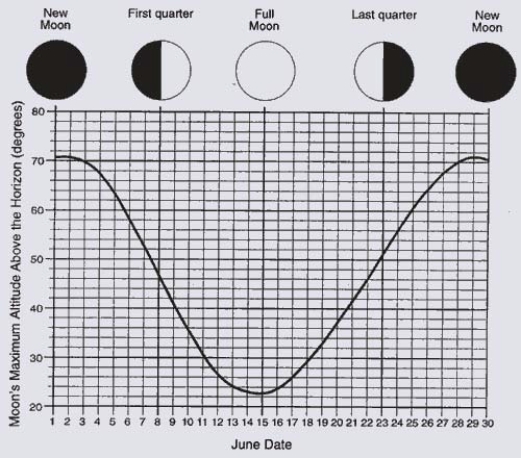
A) -3.43 degrees per day
B) -16 degrees per day
C) -7 degrees per day
D) None of the above.
A) -3.43 degrees per day
B) -16 degrees per day
C) -7 degrees per day
D) None of the above.
Question
The graph below shows the fundraising of the Republican National Committee, in millions of dollars, as a function of the date.During the period shown on the graph when was the minimum amount of funds raised, and what was that amount? 
A) The Committee raised 10 million dollars in 1993.
B) The Committee raised 17 million dollars in 1995.
C) The Committee raised 12 million dollars in 1997.
D) The Committee raised 21 million dollars in 2009.
A) The Committee raised 10 million dollars in 1993.
B) The Committee raised 17 million dollars in 1995.
C) The Committee raised 12 million dollars in 1997.
D) The Committee raised 21 million dollars in 2009.
Question
The graph below shows the atmospheric pressure, in millibars of mercury, as a function of altitude in meters.According to the graph, which of the following sentences best describes the relationship between pressure and altitude? 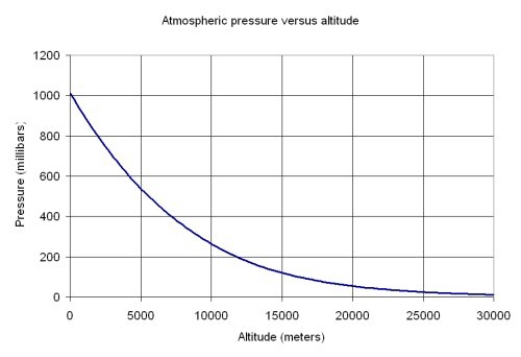
A) Pressure decreases with altitude, but at higher altitudes a small change in altitude makes relatively little difference in pressure.
B) Pressure decreases at an increasing rate as altitude increases.
C) Pressure is concave down with respect to altitude.
D) As altitude increases pressure does not change.
Question
Which of the following stories best fits the graph below? 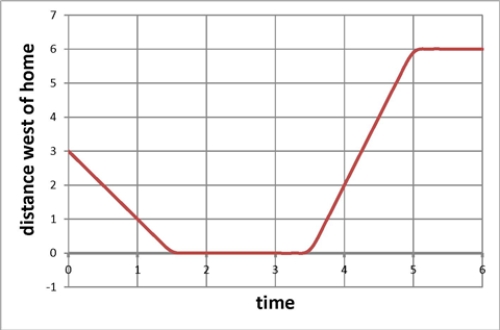
A) I left home walking to class but forgot my book.I went back home for the book and then went to math class.
B) I left home and went to math class.After class I returned home.
C) I left English class, walked home for lunch, then went to math class.
D) I went from English class to math class.After math I walked home.
A) I left home walking to class but forgot my book.I went back home for the book and then went to math class.
B) I left home and went to math class.After class I returned home.
C) I left English class, walked home for lunch, then went to math class.
D) I went from English class to math class.After math I walked home.
Question
The graph below shows the blood-glucose levels, in milligrams per deciliter, as a function of hours since a meal was ingested.The three graphs are for a healthy person (labeled normal), a prediabetic, and a diabetic person.During the period shown on the graph, what is the shortest time since eating that glucose levels are the same for a healthy person and a prediabetic?

A) About 6 hours after eating
B) About 3 hours after eating
C) At about 1 hour after eating
D) None of the above
A) About 6 hours after eating
B) About 3 hours after eating
C) At about 1 hour after eating
D) None of the above
Question
The graph below shows the growth rate G, in water fleas per day, of a population of water fleas as a function of the population size N.Calculate the average rate of change in G from 130 to 160 water fleas. 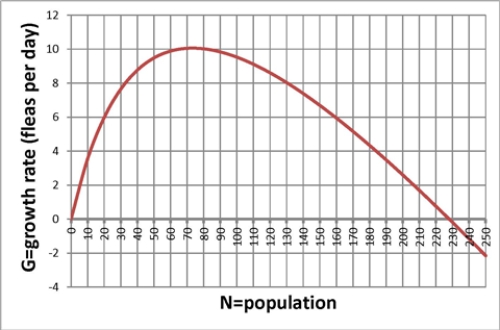
A) -0.07 water fleas per day per water flea.
B) 6 water fleas per day per water flea.
C) 30 water fleas per day per water flea.
D) None of the above.
A) -0.07 water fleas per day per water flea.
B) 6 water fleas per day per water flea.
C) 30 water fleas per day per water flea.
D) None of the above.

Unlock Deck
Sign up to unlock the cards in this deck!
Unlock Deck
Unlock Deck
1/38
Play
Full screen (f)
Deck 3: Functions Given by Graphs
1
Choose the answer that best completes the following sentence.A point of inflection occurs where...
A) concavity changes
B) concavity is at a maximum
C) the graph is increasing
D) the graph is bent
A) concavity changes
B) concavity is at a maximum
C) the graph is increasing
D) the graph is bent
concavity changes
2
Below is a graph of a function .Over what region(s) is the function decreasing?
A) from 0 to 1 and from 4 to 6
B) from 1 to 4
C) from -20 to 10
D) None of the above
.Over what region(s) is the function decreasing?
A) from 0 to 1 and from 4 to 6
B) from 1 to 4
C) from -20 to 10
D) None of the above
from 1 to 4
3
You put a drink in the freezer to cool.You take it out of the freezer when it is cold.But you forget about the drink and leave it sitting on the kitchen counter.The graph below shows the temperature, in degrees, of the drink t minutes after the drink is placed in the freezer.What is the temperature in the kitchen?
A) 20 degrees
B) 60 degrees
C) 70 degrees
D) None of the above
A) 20 degrees
B) 60 degrees
C) 70 degrees
D) None of the above
70 degrees
4
Inflection points may occur where a function is increasing at the fastest rate.
Unlock Deck
Unlock for access to all 38 flashcards in this deck.
Unlock Deck
k this deck
5
The graph of a function that is increasing at an increasing rate is increasing and concave up.
Unlock Deck
Unlock for access to all 38 flashcards in this deck.
Unlock Deck
k this deck
6
Below is a graph of a function .Find the value of .
A) 8
B) 2
C) 15.20
D) None of the above
.Find the value of .
A) 8
B) 2
C) 15.20
D) None of the above
Unlock Deck
Unlock for access to all 38 flashcards in this deck.
Unlock Deck
k this deck
7
Below is a graph of a function .Find the average rate of change in f from 1 to 3 .
A) 3
B) 2
C) 4
D) None of the above
.Find the average rate of change in f from 1 to 3 .
A) 3
B) 2
C) 4
D) None of the above
Unlock Deck
Unlock for access to all 38 flashcards in this deck.
Unlock Deck
k this deck
8
A decreasing graph is always concave down.
Unlock Deck
Unlock for access to all 38 flashcards in this deck.
Unlock Deck
k this deck
9
Below is a graph of a function .Find the average rate of change in f from 4 to 10 .
A) 20
B) -5
C) -30
D) None of the above
.Find the average rate of change in f from 4 to 10 .
A) 20
B) -5
C) -30
D) None of the above
Unlock Deck
Unlock for access to all 38 flashcards in this deck.
Unlock Deck
k this deck
10
Below is a graph of a function .Over what region(s) is the function increasing?
A) from 3 to 6
B) from 0 to 3
C) at
D) None of the above
.Over what region(s) is the function increasing?
A) from 3 to 6
B) from 0 to 3
C) at
D) None of the above
Unlock Deck
Unlock for access to all 38 flashcards in this deck.
Unlock Deck
k this deck
11
Below is a graph of a function .What is the value of ?
A) 5
B) -5
C) 8
D) None of the above
.What is the value of ?
A) 5
B) -5
C) 8
D) None of the above
Unlock Deck
Unlock for access to all 38 flashcards in this deck.
Unlock Deck
k this deck
12
Choose the answer that best completes the following sentence.A graph that is increasing and concave up represents a function that is ...
A) increasing at an increasing rate
B) increasing at a decreasing rate
C) decreasing at a decreasing rate
D) decreasing at an increasing rate
A) increasing at an increasing rate
B) increasing at a decreasing rate
C) decreasing at a decreasing rate
D) decreasing at an increasing rate
Unlock Deck
Unlock for access to all 38 flashcards in this deck.
Unlock Deck
k this deck
13
Below is a graph of a function .Find the largest value of x so that .
A) 3
B) 2
C) 4
D) None of the above
.Find the largest value of x so that .
A) 3
B) 2
C) 4
D) None of the above
Unlock Deck
Unlock for access to all 38 flashcards in this deck.
Unlock Deck
k this deck
14
Below is a graph of a function .Over what region(s) is the graph concave up?
A) at
B) from 0 to 3
C) from 3 to 6
D) None of the above
.Over what region(s) is the graph concave up?
A) at
B) from 0 to 3
C) from 3 to 6
D) None of the above
Unlock Deck
Unlock for access to all 38 flashcards in this deck.
Unlock Deck
k this deck
15
Below is a graph of a function .At what value of x does f reach its maximum value, and what is that value?
A) 50.00
B) maximum of 60 at
C) maximum of 2 at
D) None of the above
.At what value of x does f reach its maximum value, and what is that value?
A) 50.00
B) maximum of 60 at
C) maximum of 2 at
D) None of the above
Unlock Deck
Unlock for access to all 38 flashcards in this deck.
Unlock Deck
k this deck
16
A graph that is concave up represents a function that is increasing.
Unlock Deck
Unlock for access to all 38 flashcards in this deck.
Unlock Deck
k this deck
17
Below is a graph of a function .What is the limiting value for f?
A) 60
B) 20
C) 50
D) None of the above
.What is the limiting value for f? A) 60
B) 20
C) 50
D) None of the above
Unlock Deck
Unlock for access to all 38 flashcards in this deck.
Unlock Deck
k this deck
18
Choose the answer that best completes the following sentence.A graph that is decreasing and concave up represents a function that is ...
A) increasing at an increasing rate
B) increasing at a decreasing rate
C) decreasing at a decreasing rate
D) decreasing at an increasing rate
A) increasing at an increasing rate
B) increasing at a decreasing rate
C) decreasing at a decreasing rate
D) decreasing at an increasing rate
Unlock Deck
Unlock for access to all 38 flashcards in this deck.
Unlock Deck
k this deck
19
The graph of a function that is decreasing at a decreasing rate is decreasing and concave up.
Unlock Deck
Unlock for access to all 38 flashcards in this deck.
Unlock Deck
k this deck
20
Below is a graph of a function .Find the value of .
A) 10
B) 20.00
C) 50
D) None of the above
.Find the value of .
A) 10
B) 20.00
C) 50
D) None of the above
Unlock Deck
Unlock for access to all 38 flashcards in this deck.
Unlock Deck
k this deck
21
The graph below shows the numbers, in thousands, of men and women of a given height in a population.What are the most common heights for men and for women?
A) The most common height for both men and women is about 170 centimeters.
B) The most common height for women is about 160 centimeters, and the most common height for men is about 177 centimeters.
C) The most common height for men is about 110 centimeters, and the most common height for women is about 120 centimeters.
D) None of the above.
Unlock Deck
Unlock for access to all 38 flashcards in this deck.
Unlock Deck
k this deck
22
The graph below shows the atmospheric pressure P, in millibars of mercury, as a function of altitude A in meters.According to the graph, what is the approximate value of the solution for A of the equation ?
A) meters
B) meters
C) meters.
D) The equation has no solution.
?
A)
metersB)
metersC)
meters.D) The equation has no solution.
Unlock Deck
Unlock for access to all 38 flashcards in this deck.
Unlock Deck
k this deck
23
Which of the following stories best fits the graph below?
A) I left home walking to class but forgot my book.I went back home for the book and then went to math class.
B) I left home and went to math class.After class I returned home.
C) I left English class, walked home for lunch, then went to math class.
D) I went from English class to math class.After math I walked home.
Unlock Deck
Unlock for access to all 38 flashcards in this deck.
Unlock Deck
k this deck
24
Which of the following stories best fits the graph below?
A) I left home walking to class but forgot my book.I went back home for the book and then went to math class.
B) I left home and went to math class.After class I returned home.
C) I left English class, walked home for lunch, then went to math class.
D) I went from English class to math class.After math I walked home.
A) I left home walking to class but forgot my book.I went back home for the book and then went to math class.
B) I left home and went to math class.After class I returned home.
C) I left English class, walked home for lunch, then went to math class.
D) I went from English class to math class.After math I walked home.
Unlock Deck
Unlock for access to all 38 flashcards in this deck.
Unlock Deck
k this deck
25
The graph below shows the fundraising of the Republican National Committee, in millions of dollars, as a function of the date.The graph indicates that there are two solutions d of the equation million.What two dates (approximately) correspond to these solutions?
A) About 2001 and 2009.
B) About 1995 and 2005
C) About 1993 and 2009
D) There is no solution.
of the Republican National Committee, in millions of dollars, as a function of the date.The graph indicates that there are two solutions d of the equation million.What two dates (approximately) correspond to these solutions? A) About 2001 and 2009.
B) About 1995 and 2005
C) About 1993 and 2009
D) There is no solution.
Unlock Deck
Unlock for access to all 38 flashcards in this deck.
Unlock Deck
k this deck
26
The graph below shows the value, in dollars, of a foreign currency t years after 2000. For what two dates between 2000 and 2020 would earn you the most money if you bought the foreign currency on the first date and sold on the second?
A) Buy in 2002 and sell in 2008
B) Buy in 2008 and sell the same year
C) Buy in 2005 and sell in 2008
D) None of the above
A) Buy in 2002 and sell in 2008
B) Buy in 2008 and sell the same year
C) Buy in 2005 and sell in 2008
D) None of the above
Unlock Deck
Unlock for access to all 38 flashcards in this deck.
Unlock Deck
k this deck
27
Which of the following stories best fits the graph below?
A) I left home walking to class but forgot my book.I went back home for the book and then went to math class.
B) I left home and went to math class.After class I returned home.
C) I left English class, walked home for lunch, then went to math class.
D) I went from English class to math class.After math I walked home.
A) I left home walking to class but forgot my book.I went back home for the book and then went to math class.
B) I left home and went to math class.After class I returned home.
C) I left English class, walked home for lunch, then went to math class.
D) I went from English class to math class.After math I walked home.
Unlock Deck
Unlock for access to all 38 flashcards in this deck.
Unlock Deck
k this deck
28
The graph below shows the maximum angle above the horizon reached by the moon during the month of June.On what day does the smallest maximum angle occur, and what is that angle?
A) The smallest maximum angle of about 71 degrees occurs on June 29.
B) The smallest maximum angle occurs at the time of the new moon.
C) The smallest maximum angle of about 22 degrees occurs on June 15.
D) The smallest maximum angle of about 71 degrees occurs on June 2.
A) The smallest maximum angle of about 71 degrees occurs on June 29.
B) The smallest maximum angle occurs at the time of the new moon.
C) The smallest maximum angle of about 22 degrees occurs on June 15.
D) The smallest maximum angle of about 71 degrees occurs on June 2.
Unlock Deck
Unlock for access to all 38 flashcards in this deck.
Unlock Deck
k this deck
29
The graph below shows the blood-glucose levels, in milligrams per deciliter, as a function of hours since a meal was ingested.The three graphs are for a healthy person (labeled normal), a prediabetic, and a diabetic person.The graph indicates that regardless of diabetic condition, blood-glucose reaches a maximum concentration about how many hours after eating?
A) About 110 milligrams per deciliter
B) About 70 milligrams per deciliter
C) About 1 hour after eating
D) About 4.5 hours after eating
A) About 110 milligrams per deciliter
B) About 70 milligrams per deciliter
C) About 1 hour after eating
D) About 4.5 hours after eating
Unlock Deck
Unlock for access to all 38 flashcards in this deck.
Unlock Deck
k this deck
30
The graph below shows the value, in dollars, of a foreign currency t years after 2000. In what year from 2000 to 2020 did the value of the foreign currency reach its maximum, and what was that maximum value?
A) The maximum value of $1.80 occurred in 2008.
B) The maximum value of $1.20 occurred in 2005.
C) The maximum value of $1.40 occurred in 2002.
D) The maximum value of $0.90 occurred in 2020.
A) The maximum value of $1.80 occurred in 2008.
B) The maximum value of $1.20 occurred in 2005.
C) The maximum value of $1.40 occurred in 2002.
D) The maximum value of $0.90 occurred in 2020.
Unlock Deck
Unlock for access to all 38 flashcards in this deck.
Unlock Deck
k this deck
31
The graph below shows the numbers, in thousands, of men and women of a given height in a population.This graph allows us to conclude that:
A) Women are taller than men.
B) The most common height for women is about 160 centimeters.
C) The most common height for men is about 170 centimeters.
D) There are fewer tall men than tall women.
A) Women are taller than men.
B) The most common height for women is about 160 centimeters.
C) The most common height for men is about 170 centimeters.
D) There are fewer tall men than tall women.
Unlock Deck
Unlock for access to all 38 flashcards in this deck.
Unlock Deck
k this deck
32
Below is a graph of a function .At what value of x does the point of inflection occur?
A) at
B) at
C) at
D) None of the above
.At what value of x does the point of inflection occur?
A) at
B) at
C) at
D) None of the above
Unlock Deck
Unlock for access to all 38 flashcards in this deck.
Unlock Deck
k this deck
33
The graph below shows the maximum angle above the horizon reached by the moon during the month of June.What was the average rate of change in the maximum angle from June 8 to June 14?
A) -3.43 degrees per day
B) -16 degrees per day
C) -7 degrees per day
D) None of the above.
A) -3.43 degrees per day
B) -16 degrees per day
C) -7 degrees per day
D) None of the above.
Unlock Deck
Unlock for access to all 38 flashcards in this deck.
Unlock Deck
k this deck
34
The graph below shows the fundraising of the Republican National Committee, in millions of dollars, as a function of the date.During the period shown on the graph when was the minimum amount of funds raised, and what was that amount?
A) The Committee raised 10 million dollars in 1993.
B) The Committee raised 17 million dollars in 1995.
C) The Committee raised 12 million dollars in 1997.
D) The Committee raised 21 million dollars in 2009.
A) The Committee raised 10 million dollars in 1993.
B) The Committee raised 17 million dollars in 1995.
C) The Committee raised 12 million dollars in 1997.
D) The Committee raised 21 million dollars in 2009.
Unlock Deck
Unlock for access to all 38 flashcards in this deck.
Unlock Deck
k this deck
35
The graph below shows the atmospheric pressure, in millibars of mercury, as a function of altitude in meters.According to the graph, which of the following sentences best describes the relationship between pressure and altitude?
A) Pressure decreases with altitude, but at higher altitudes a small change in altitude makes relatively little difference in pressure.
B) Pressure decreases at an increasing rate as altitude increases.
C) Pressure is concave down with respect to altitude.
D) As altitude increases pressure does not change.
Unlock Deck
Unlock for access to all 38 flashcards in this deck.
Unlock Deck
k this deck
36
Which of the following stories best fits the graph below?
A) I left home walking to class but forgot my book.I went back home for the book and then went to math class.
B) I left home and went to math class.After class I returned home.
C) I left English class, walked home for lunch, then went to math class.
D) I went from English class to math class.After math I walked home.
A) I left home walking to class but forgot my book.I went back home for the book and then went to math class.
B) I left home and went to math class.After class I returned home.
C) I left English class, walked home for lunch, then went to math class.
D) I went from English class to math class.After math I walked home.
Unlock Deck
Unlock for access to all 38 flashcards in this deck.
Unlock Deck
k this deck
37
The graph below shows the blood-glucose levels, in milligrams per deciliter, as a function of hours since a meal was ingested.The three graphs are for a healthy person (labeled normal), a prediabetic, and a diabetic person.During the period shown on the graph, what is the shortest time since eating that glucose levels are the same for a healthy person and a prediabetic?
A) About 6 hours after eating
B) About 3 hours after eating
C) At about 1 hour after eating
D) None of the above
A) About 6 hours after eating
B) About 3 hours after eating
C) At about 1 hour after eating
D) None of the above
Unlock Deck
Unlock for access to all 38 flashcards in this deck.
Unlock Deck
k this deck
38
The graph below shows the growth rate G, in water fleas per day, of a population of water fleas as a function of the population size N.Calculate the average rate of change in G from 130 to 160 water fleas.
A) -0.07 water fleas per day per water flea.
B) 6 water fleas per day per water flea.
C) 30 water fleas per day per water flea.
D) None of the above.
A) -0.07 water fleas per day per water flea.
B) 6 water fleas per day per water flea.
C) 30 water fleas per day per water flea.
D) None of the above.
Unlock Deck
Unlock for access to all 38 flashcards in this deck.
Unlock Deck
k this deck
Unlock Deck
Unlock for access to all 38 flashcards in this deck.


