Deck 2: Picturing Variation With Graphs
Full screen (f)
Question
Question
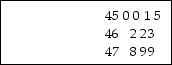
Find the original data set from the stemplot given below. 

A)450, 450, 451, 455, 462, 462, 463
B)45, 41, 45, 46, 42, 42, 43, 47, 48, 49, 49
C)450, 450, 451, 455, 462, 462, 463, 478, 479, 479
D)450, 451, 455, 462, 463, 478, 479
A)450, 450, 451, 455, 462, 462, 463
B)45, 41, 45, 46, 42, 42, 43, 47, 48, 49, 49
C)450, 450, 451, 455, 462, 462, 463, 478, 479, 479
D)450, 451, 455, 462, 463, 478, 479
Question
Based on the histogram below, would it be unusual to be on hold for 5 minutes or more at this call center? 
A)Not enough information given.
B)Yes, it would be unusual.
C)No, it would not be unusual.
A)Not enough information given.
B)Yes, it would be unusual.
C)No, it would not be unusual.
Question
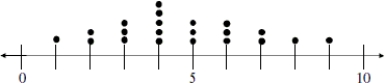
Each day for twenty days a record store owner counts the number of customers who purchase an album by a certain artist. The data and a dotplot of the data are shown below: Data set: 1, 3, 4, 4, 5, 6, 7, 2, 3, 4, 4, 5, 6, 8, 2, 3, 4, 5, 6, 7, 9
 Which of the following statements can be made using the given information?
A)During the twenty days when the record store owner collected data, there were some days when no one purchased an album by the artist.
B)On the first day of collecting data the record store owner had one person purchase an album by the artist.
C)The dotplot shows that this data has a roughly bell- shaped distribution.
D)None of these
Which of the following statements can be made using the given information?A)During the twenty days when the record store owner collected data, there were some days when no one purchased an album by the artist.
B)On the first day of collecting data the record store owner had one person purchase an album by the artist.
C)The dotplot shows that this data has a roughly bell- shaped distribution.
D)None of these
Question
The distribution of heights of adult males tends to be symmetrical.
A)
B)

C)
A)
B)
C)
Question
The following graphic was used to visually summarize the following statement made by Supertuf Bicycle Tire Company in a recent magazine advertisement: "Our patented Supertuf bicycle tire design lasts twice as long as the leading competitor's tire design." Does the graphic correctly represent the statement made in the advertisement? 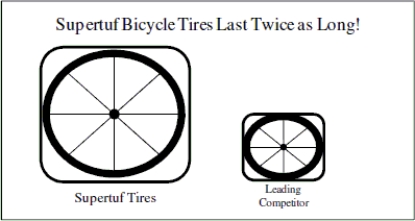
A)Not enough information available to make a judgment. More information is needed about how long Supertuf tires last and how long the leading competitor's tires last.
B)Yes, the area of the first tire is twice the area of the second tire.
C)No, although the dimensions have doubled, the area of the first tire is more than twice the area of the second tire so the graphic incorrectly represents what is stated in the advertisement.
Question
A group of junior high athletes was asked what team sport was their favorite. The data are summarized in the table below. On the pie chart, which area would correspond to the category "Soccer"? 
A)Area A
B)Area B
C)Area C
D)Area D
A)Area A
B)Area B
C)Area C
D)Area D
Question
Question
A group of junior high athletes was asked what team sport was their favorite. The data are summarized in the table below. On the pie chart, which area would correspond to the category "Volleyball"? 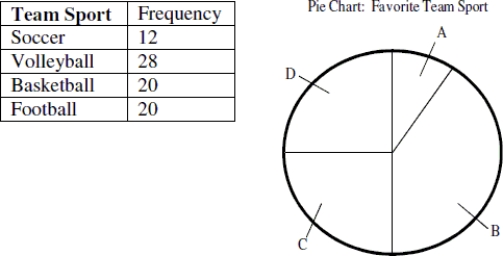
A)Area A
B)Area B
C)Area C
D)Area D
A)Area A
B)Area B
C)Area C
D)Area D
Question
A collection of twenty college students was asked how much cash they currently had in their possession. The data is summarized in the stemplot below. Typically, how much money does a student have in his or her possession? 
A)$60- $70
B)Not enough information available
C)$40- $50
D)$30- $40
A)$60- $70
B)Not enough information available
C)$40- $50
D)$30- $40
Question
Question
For twenty days a record store owner counts the number of customers who purchase an album by a certain artist. The data and a dotplot of the data are shown below: Data set: 1, 3, 4, 4, 5, 6, 7, 2, 3, 4, 4, 5, 6, 8, 2, 3, 4, 5, 6, 7, 9
 Which of the following statements can be made using the given information?
A)On five of the twenty days observed by the record store owner, there were four albums by the artist purchased.
B)The dotplot shows that this data has a roughly bell- shaped distribution.
C)During the twenty days when the record store owner collected data, at least one album by the artist was purchased each day.
D)All of these
Which of the following statements can be made using the given information?A)On five of the twenty days observed by the record store owner, there were four albums by the artist purchased.
B)The dotplot shows that this data has a roughly bell- shaped distribution.
C)During the twenty days when the record store owner collected data, at least one album by the artist was purchased each day.
D)All of these
Question
The distribution of test scores for a group of adults on a written driving exam following a refresher course tends to be left- skewed.
A)
B)

C)
A)
B)
C)
Question
Data were collected on hand grip strength of adults. The histogram below summarizes the data. Which statement is true about the distribution of the data shown in the graph? 
A)There must have been a mistake made in data collection because the distribution should be bell- shaped.
B)The graph shows evidence that two different groups may have been combined into one collection.
C)The best estimate of typical grip strength is 80- 90 pounds because it is in the center of the distribution.
D)The graph is useless because it is bimodal.
Question
Question
Question
Question
A collection of twenty college students was asked how much cash they currently had in their possession. The data is summarized in the stemplot below. How many students had between forty and fifty dollars in their possession? 
A)9
B)10
C)8
D)Not enough information available
A)9
B)10
C)8
D)Not enough information available
Question
The following graphic was used to visually summarize the following statement made by Incredi- gro Fertilizer Company in a recent newspaper advertisement: "Our new Incredi- gro Fertilizer for flowers will grow your flowers two times faster than water alone." 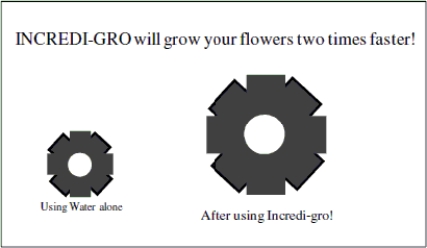
A)No, although the dimensions have doubled, the area of the first flower is one quarter of the area of the second flower so the graphic incorrectly represents what is stated in the advertisement.
B)Yes, the area of the first flower is half the area of the second flower.
C)Not enough information available to make a judgment. More information is need about how fast flowers treated with incredi- gro fertilizer will grow and how fast flowers treated with water alone will grow.
Question
Question
Question
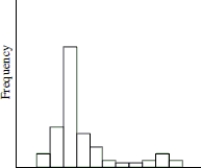
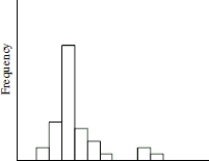
The histogram below displays the distribution of the length of time on hold, for a collection of customers, calling a repair call center. Use the histogram to select the true statement. 
A)The distribution shows that the data was highly variable with some callers waiting on hold as many as 20 minutes.
B)The distribution is symmetrical. The number of callers who waited on hold for less than three minutes was the same as the number of callers who waited on hold for more than three minutes.
C)The distribution is left- skewed and most callers waited on hold at least three minutes.
D)The distribution is right- skewed and most callers waited on hold less than three minutes.
Question
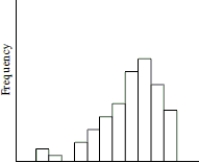
The data in the histogram summarizes the pitch speed of a sample of 75 pitches for a college pitcher during one season. Which of the following statements best describes the distribution of the histogram below? 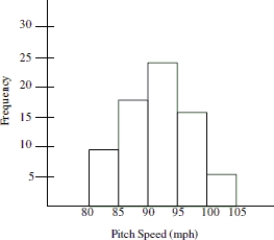
A)The distribution is right- skewed and shows that most of the pitches were more than 90 mph.
B)The distribution has a large amount of variation which can be seen by comparing the heights of the bars in the histogram.
C)The distribution is left- skewed and shows that most of the pitches were less than 95 mph.
D)The distribution is symmetric around a pitch speed of about 93 mph.
Question
The distribution of the numbers of times individuals in the 18- 24 age group log onto a social networking website during the course of a day tends to be right- skewed.
A)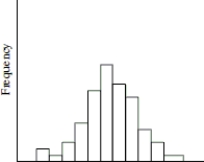
B)
C)
A)
B)
C)
Question
The histogram below is the distribution of heights for a randomly selected Boy Scout troupe. Choose the statement that is true based on information from the histogram. 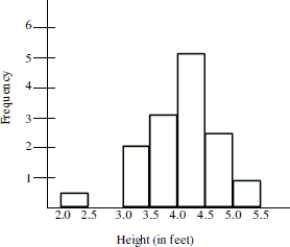
A)The smallest value is so extreme that it is possible that a mistake was made in recording the data.
B)The gap between the two smallest values indicates an outlier may be present.
C)Although the smallest value does not fit the pattern, it should not be altogether disregarded. It is possible that the Boy Scout is 2.4 feet tall.
D)All of these are true statements.
Question
Question
Based on the histogram below, would it be unusual to be on hold for at least 6 minutes at this call center? 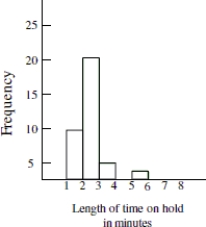
A)Not enough information given.
B)No, it would not be unusual.
C)Yes, it would be unusual.
A)Not enough information given.
B)No, it would not be unusual.
C)Yes, it would be unusual.
Question
The distribution of test scores for a group of adults on a written driving exam following a refresher course tends to be left- skewed.
A)

B)

C)
A)
B)
C)
Question
The distribution of heights of adult females tends to be symmetrical.
A)

B)
C)
A)
B)
C)
Question
Data was collected on hand grip strength of adults. The histogram below summarizes the data. Which statement is true about the distribution of the data shown in the graph? 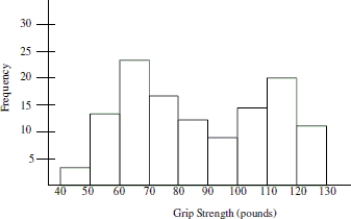
A)The graph shows evidence that two different groups may have been combined into one collection.
B)The graph is useless because it is bimodal.
C)There must have been a mistake made in data collection because the distribution should be bell- shaped.
D)The best estimate of typical grip strength is 80- 90 pounds because it is in the center of the distribution.
Question
The histogram below shows the distribution of pass rates on a swimming test of all children who completed a four week summer swim course at the local YMCA. What is the typical pass rate for the swim test? 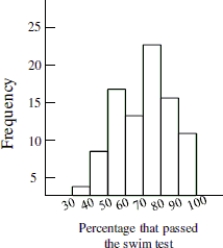
A)About 55%
B)About 95%
C)Not enough information available
D)About 75%
A)About 55%
B)About 95%
C)Not enough information available
D)About 75%
Question
The histogram shows the distribution of pitch speeds for a sample of 75 pitches for a college pitcher during one season. Which of the following statements best describes the distribution of the histogram below? 
A)The distribution has a large amount of variation which can be seen by comparing the heights of the bars in the histogram.
B)The distribution is left- skewed and shows that most of the pitches were less than 95 mph.
C)The distribution is symmetric around a pitch speed of about 93 mph.
D)The distribution is right- skewed and shows that most of the pitches were more than 90 mph.
Question
Question
Which of the following statements best describes the distribution and variability of the histogram below? The data in the histogram summarizes length of time on hold for a collection of customers calling a repair call center. 
A)The distribution shows that the data was highly variable with some callers waiting on hold as many as 20 minutes.
B)The distribution is left- skewed and most callers waited on hold at least three minutes.
C)The distribution is symmetrical. The number of callers who waited on hold for less than three minutes was the same as the number of callers who waited on hold for more than three minutes.
D)The distribution is right- skewed and most callers waited on hold less than three minutes.
Question
The histogram below shows the distribution of pass rates on a swimming test of all children who completed a four week summer swim course at the local YMCA. How many of the courses had a pass rate less than 40 percent? 
A)Not enough information available
B)About 5
C)About 3
D)About 8
A)Not enough information available
B)About 5
C)About 3
D)About 8
Question
The distribution of the numbers of times individuals in the 18- 24 age group log onto a social networking website during the course of a day tends to be right- skewed.
A)
B)
C)

A)
B)
C)
Question
Question
The graph below displays the number of applications for a concealed weapons permit in Montcalm County, Michigan, for each of three years. A reported interprets this graph to mean that applications in 2010 are more than twice the level in 2008. Is the reported making a correct interpretation? 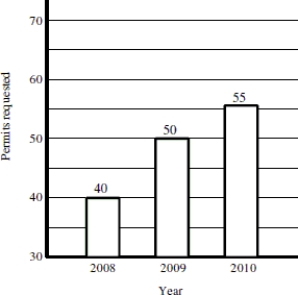
A)Yes. The bar for 2010 is twice the height of the bar for 2008 and the number of applications indicated above the bars shows that applications in 2010 are more than twice the level in 2008.
B)No. Although the 2010 bar is more than twice the height of the 2008, the bars do not begin at 0 applications, so the graph does not correctly represent the data. Fifty- five is not equal to two times the number of applications made in 2008.
C)No. The width of the bars is identical, indicating that the number of applications in 2010 is no different from 2008.
Question
The graph below displays the number of homicides in the city of Flint, Michigan for each of the last three years. A reported interprets this graph to mean that the number of murders in 2010 was more than twice the number of murders in 2008. Is the reporter making a correct interpretation? 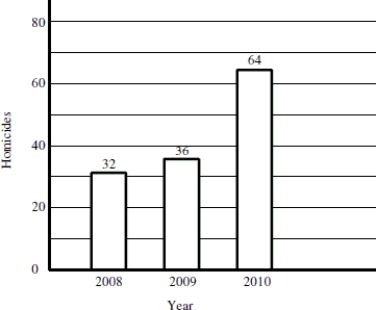
A)No. The width of the bars is identical, indicating that the number of murders in 2010 is no different from 2008.
B)There is not enough information given in the graph to determine whether the reporter's interpretation is correct or not.
C)Yes. The bar for 2010 is twice the height of the bar for 2008 and the number of murders indicated above the bars confirms that murders in 2010 were more than twice the level in 2008.
Question
Find the original data set from the stemplot given below. 


A)45, 41, 45, 46, 42, 42, 43, 47, 40, 48, 49, 49, 49
B)450, 451, 455, 462, 463, 470, 478, 479
C)450, 450, 451, 455, 462, 462, 463
D)450, 450, 451, 455, 462, 462, 463, 470, 478, 479, 479, 479
A)45, 41, 45, 46, 42, 42, 43, 47, 40, 48, 49, 49, 49
B)450, 451, 455, 462, 463, 470, 478, 479
C)450, 450, 451, 455, 462, 462, 463
D)450, 450, 451, 455, 462, 462, 463, 470, 478, 479, 479, 479
Question
Question
Question
Question
Question
Question
Question
Question
Question
Question
Question
Question
Question
Question
The histograms below show the distribution of quiz scores on a ten point math quiz with and without a fifteen minute review before the quiz. Describe the different shapes of the distributions. Does it appear that the fifteen minute review resulted in improved quiz scores? Explain the evidence that supports your conclusion.

Question
Question
Question
Question
Question
Question

Unlock Deck
Sign up to unlock the cards in this deck!
Unlock Deck
Unlock Deck
1/60
Play
Full screen (f)
Deck 2: Picturing Variation With Graphs
1
What is the approximate percentage of participants had a heart rate less than 130 bpm?
A)13%
B)33%
C)47%
D)53%
A)13%
B)33%
C)47%
D)53%
47%
2
Find the original data set from the stemplot given below.
A)450, 450, 451, 455, 462, 462, 463
B)45, 41, 45, 46, 42, 42, 43, 47, 48, 49, 49
C)450, 450, 451, 455, 462, 462, 463, 478, 479, 479
D)450, 451, 455, 462, 463, 478, 479
A)450, 450, 451, 455, 462, 462, 463
B)45, 41, 45, 46, 42, 42, 43, 47, 48, 49, 49
C)450, 450, 451, 455, 462, 462, 463, 478, 479, 479
D)450, 451, 455, 462, 463, 478, 479
450, 450, 451, 455, 462, 462, 463, 478, 479, 479
3
Based on the histogram below, would it be unusual to be on hold for 5 minutes or more at this call center?
A)Not enough information given.
B)Yes, it would be unusual.
C)No, it would not be unusual.
A)Not enough information given.
B)Yes, it would be unusual.
C)No, it would not be unusual.
Yes, it would be unusual.
4
Each day for twenty days a record store owner counts the number of customers who purchase an album by a certain artist. The data and a dotplot of the data are shown below: Data set: 1, 3, 4, 4, 5, 6, 7, 2, 3, 4, 4, 5, 6, 8, 2, 3, 4, 5, 6, 7, 9
Which of the following statements can be made using the given information?
A)During the twenty days when the record store owner collected data, there were some days when no one purchased an album by the artist.
B)On the first day of collecting data the record store owner had one person purchase an album by the artist.
C)The dotplot shows that this data has a roughly bell- shaped distribution.
D)None of these
Which of the following statements can be made using the given information?A)During the twenty days when the record store owner collected data, there were some days when no one purchased an album by the artist.
B)On the first day of collecting data the record store owner had one person purchase an album by the artist.
C)The dotplot shows that this data has a roughly bell- shaped distribution.
D)None of these
Unlock Deck
Unlock for access to all 60 flashcards in this deck.
Unlock Deck
k this deck
5
The distribution of heights of adult males tends to be symmetrical.
A)
B)
C)
A)
B)
C)
Unlock Deck
Unlock for access to all 60 flashcards in this deck.
Unlock Deck
k this deck
6
The following graphic was used to visually summarize the following statement made by Supertuf Bicycle Tire Company in a recent magazine advertisement: "Our patented Supertuf bicycle tire design lasts twice as long as the leading competitor's tire design." Does the graphic correctly represent the statement made in the advertisement?
A)Not enough information available to make a judgment. More information is needed about how long Supertuf tires last and how long the leading competitor's tires last.
B)Yes, the area of the first tire is twice the area of the second tire.
C)No, although the dimensions have doubled, the area of the first tire is more than twice the area of the second tire so the graphic incorrectly represents what is stated in the advertisement.
Unlock Deck
Unlock for access to all 60 flashcards in this deck.
Unlock Deck
k this deck
7
A group of junior high athletes was asked what team sport was their favorite. The data are summarized in the table below. On the pie chart, which area would correspond to the category "Soccer"?
A)Area A
B)Area B
C)Area C
D)Area D
A)Area A
B)Area B
C)Area C
D)Area D
Unlock Deck
Unlock for access to all 60 flashcards in this deck.
Unlock Deck
k this deck
8
How many participants had a heart rate between 120 and 130 bpm?
A)5
B)3
C)2
D)4
A)5
B)3
C)2
D)4
Unlock Deck
Unlock for access to all 60 flashcards in this deck.
Unlock Deck
k this deck
9
A group of junior high athletes was asked what team sport was their favorite. The data are summarized in the table below. On the pie chart, which area would correspond to the category "Volleyball"?
A)Area A
B)Area B
C)Area C
D)Area D
A)Area A
B)Area B
C)Area C
D)Area D
Unlock Deck
Unlock for access to all 60 flashcards in this deck.
Unlock Deck
k this deck
10
A collection of twenty college students was asked how much cash they currently had in their possession. The data is summarized in the stemplot below. Typically, how much money does a student have in his or her possession?
A)$60- $70
B)Not enough information available
C)$40- $50
D)$30- $40
A)$60- $70
B)Not enough information available
C)$40- $50
D)$30- $40
Unlock Deck
Unlock for access to all 60 flashcards in this deck.
Unlock Deck
k this deck
11
Data was collected on the heights of a group of five boy scouts, between the ages of seven and eleven. The following heights were recorded in inches: 29, 60, 52, 57, 52. Choose the true statement:
A)Although the smallest value does not fit the pattern, it should not be altogether disregarded.
B)The gap between the two smallest values indicates an outlier may be present.
C)The smallest value is so extreme that it is possible that a mistake was made in recording the data.
D)All of these are true statements.
Unlock Deck
Unlock for access to all 60 flashcards in this deck.
Unlock Deck
k this deck
12
For twenty days a record store owner counts the number of customers who purchase an album by a certain artist. The data and a dotplot of the data are shown below: Data set: 1, 3, 4, 4, 5, 6, 7, 2, 3, 4, 4, 5, 6, 8, 2, 3, 4, 5, 6, 7, 9
Which of the following statements can be made using the given information?
A)On five of the twenty days observed by the record store owner, there were four albums by the artist purchased.
B)The dotplot shows that this data has a roughly bell- shaped distribution.
C)During the twenty days when the record store owner collected data, at least one album by the artist was purchased each day.
D)All of these
Which of the following statements can be made using the given information?A)On five of the twenty days observed by the record store owner, there were four albums by the artist purchased.
B)The dotplot shows that this data has a roughly bell- shaped distribution.
C)During the twenty days when the record store owner collected data, at least one album by the artist was purchased each day.
D)All of these
Unlock Deck
Unlock for access to all 60 flashcards in this deck.
Unlock Deck
k this deck
13
The distribution of test scores for a group of adults on a written driving exam following a refresher course tends to be left- skewed.
A)
B)
C)
A)
B)
C)
Unlock Deck
Unlock for access to all 60 flashcards in this deck.
Unlock Deck
k this deck
14
Data were collected on hand grip strength of adults. The histogram below summarizes the data. Which statement is true about the distribution of the data shown in the graph?
A)There must have been a mistake made in data collection because the distribution should be bell- shaped.
B)The graph shows evidence that two different groups may have been combined into one collection.
C)The best estimate of typical grip strength is 80- 90 pounds because it is in the center of the distribution.
D)The graph is useless because it is bimodal.
Unlock Deck
Unlock for access to all 60 flashcards in this deck.
Unlock Deck
k this deck
15
Which category shows the least amount of variation between years?
A)Some College
B)Graduated College, Associate's Degree
C)No College
D)Graduated College, Bachelor's Degree
A)Some College
B)Graduated College, Associate's Degree
C)No College
D)Graduated College, Bachelor's Degree
Unlock Deck
Unlock for access to all 60 flashcards in this deck.
Unlock Deck
k this deck
16
What was the most common response for 1999?
A)No College
B)Some College
C)Graduated College, Bachelor's Degree
D)Graduated College, Associate's Degree
A)No College
B)Some College
C)Graduated College, Bachelor's Degree
D)Graduated College, Associate's Degree
Unlock Deck
Unlock for access to all 60 flashcards in this deck.
Unlock Deck
k this deck
17
How many participants had a heart rate between 140 and 150 bpm?
A)3
B)2
C)4
D)5
A)3
B)2
C)4
D)5
Unlock Deck
Unlock for access to all 60 flashcards in this deck.
Unlock Deck
k this deck
18
A collection of twenty college students was asked how much cash they currently had in their possession. The data is summarized in the stemplot below. How many students had between forty and fifty dollars in their possession?
A)9
B)10
C)8
D)Not enough information available
A)9
B)10
C)8
D)Not enough information available
Unlock Deck
Unlock for access to all 60 flashcards in this deck.
Unlock Deck
k this deck
19
The following graphic was used to visually summarize the following statement made by Incredi- gro Fertilizer Company in a recent newspaper advertisement: "Our new Incredi- gro Fertilizer for flowers will grow your flowers two times faster than water alone."
A)No, although the dimensions have doubled, the area of the first flower is one quarter of the area of the second flower so the graphic incorrectly represents what is stated in the advertisement.
B)Yes, the area of the first flower is half the area of the second flower.
C)Not enough information available to make a judgment. More information is need about how fast flowers treated with incredi- gro fertilizer will grow and how fast flowers treated with water alone will grow.
Unlock Deck
Unlock for access to all 60 flashcards in this deck.
Unlock Deck
k this deck
20
What percentage of the participants had a heart rate greater than 130 bpm?
A)53%
B)33%
C)27%
D)13%
A)53%
B)33%
C)27%
D)13%
Unlock Deck
Unlock for access to all 60 flashcards in this deck.
Unlock Deck
k this deck
21
Which of the following statements about bar graphs is true?
A)It is appropriate to have gaps between the bars on the graph.
B)On a bar graph, the width of the bars has no meaning.
C)It sometimes doesn't matter in which order you place the bars representing different categories.
D)All of these are true for bar graphs.
A)It is appropriate to have gaps between the bars on the graph.
B)On a bar graph, the width of the bars has no meaning.
C)It sometimes doesn't matter in which order you place the bars representing different categories.
D)All of these are true for bar graphs.
Unlock Deck
Unlock for access to all 60 flashcards in this deck.
Unlock Deck
k this deck
22
The histogram below displays the distribution of the length of time on hold, for a collection of customers, calling a repair call center. Use the histogram to select the true statement.
A)The distribution shows that the data was highly variable with some callers waiting on hold as many as 20 minutes.
B)The distribution is symmetrical. The number of callers who waited on hold for less than three minutes was the same as the number of callers who waited on hold for more than three minutes.
C)The distribution is left- skewed and most callers waited on hold at least three minutes.
D)The distribution is right- skewed and most callers waited on hold less than three minutes.
Unlock Deck
Unlock for access to all 60 flashcards in this deck.
Unlock Deck
k this deck
23
The data in the histogram summarizes the pitch speed of a sample of 75 pitches for a college pitcher during one season. Which of the following statements best describes the distribution of the histogram below?
A)The distribution is right- skewed and shows that most of the pitches were more than 90 mph.
B)The distribution has a large amount of variation which can be seen by comparing the heights of the bars in the histogram.
C)The distribution is left- skewed and shows that most of the pitches were less than 95 mph.
D)The distribution is symmetric around a pitch speed of about 93 mph.
Unlock Deck
Unlock for access to all 60 flashcards in this deck.
Unlock Deck
k this deck
24
The distribution of the numbers of times individuals in the 18- 24 age group log onto a social networking website during the course of a day tends to be right- skewed.
A)
B)
C)
A)
B)
C)
Unlock Deck
Unlock for access to all 60 flashcards in this deck.
Unlock Deck
k this deck
25
The histogram below is the distribution of heights for a randomly selected Boy Scout troupe. Choose the statement that is true based on information from the histogram.
A)The smallest value is so extreme that it is possible that a mistake was made in recording the data.
B)The gap between the two smallest values indicates an outlier may be present.
C)Although the smallest value does not fit the pattern, it should not be altogether disregarded. It is possible that the Boy Scout is 2.4 feet tall.
D)All of these are true statements.
Unlock Deck
Unlock for access to all 60 flashcards in this deck.
Unlock Deck
k this deck
26
What is the mode response for 2001?
A)No College
B)Some College
C)Graduated College, Associate's Degree
D)Graduated College, Bachelor's Degree
A)No College
B)Some College
C)Graduated College, Associate's Degree
D)Graduated College, Bachelor's Degree
Unlock Deck
Unlock for access to all 60 flashcards in this deck.
Unlock Deck
k this deck
27
Based on the histogram below, would it be unusual to be on hold for at least 6 minutes at this call center?
A)Not enough information given.
B)No, it would not be unusual.
C)Yes, it would be unusual.
A)Not enough information given.
B)No, it would not be unusual.
C)Yes, it would be unusual.
Unlock Deck
Unlock for access to all 60 flashcards in this deck.
Unlock Deck
k this deck
28
The distribution of test scores for a group of adults on a written driving exam following a refresher course tends to be left- skewed.
A)
B)
C)
A)
B)
C)
Unlock Deck
Unlock for access to all 60 flashcards in this deck.
Unlock Deck
k this deck
29
The distribution of heights of adult females tends to be symmetrical.
A)
B)
C)
A)
B)
C)
Unlock Deck
Unlock for access to all 60 flashcards in this deck.
Unlock Deck
k this deck
30
Data was collected on hand grip strength of adults. The histogram below summarizes the data. Which statement is true about the distribution of the data shown in the graph?
A)The graph shows evidence that two different groups may have been combined into one collection.
B)The graph is useless because it is bimodal.
C)There must have been a mistake made in data collection because the distribution should be bell- shaped.
D)The best estimate of typical grip strength is 80- 90 pounds because it is in the center of the distribution.
Unlock Deck
Unlock for access to all 60 flashcards in this deck.
Unlock Deck
k this deck
31
The histogram below shows the distribution of pass rates on a swimming test of all children who completed a four week summer swim course at the local YMCA. What is the typical pass rate for the swim test?
A)About 55%
B)About 95%
C)Not enough information available
D)About 75%
A)About 55%
B)About 95%
C)Not enough information available
D)About 75%
Unlock Deck
Unlock for access to all 60 flashcards in this deck.
Unlock Deck
k this deck
32
The histogram shows the distribution of pitch speeds for a sample of 75 pitches for a college pitcher during one season. Which of the following statements best describes the distribution of the histogram below?
A)The distribution has a large amount of variation which can be seen by comparing the heights of the bars in the histogram.
B)The distribution is left- skewed and shows that most of the pitches were less than 95 mph.
C)The distribution is symmetric around a pitch speed of about 93 mph.
D)The distribution is right- skewed and shows that most of the pitches were more than 90 mph.
Unlock Deck
Unlock for access to all 60 flashcards in this deck.
Unlock Deck
k this deck
33
Which of the following statements about bar graphs is true?
A)On a bar graph, the width of the bars has no meaning.
B)It sometimes doesn't matter in which order you place the bars representing different categories.
C)It is appropriate to have gaps between the bars on the graph.
D)All of these are true for bar graphs.
A)On a bar graph, the width of the bars has no meaning.
B)It sometimes doesn't matter in which order you place the bars representing different categories.
C)It is appropriate to have gaps between the bars on the graph.
D)All of these are true for bar graphs.
Unlock Deck
Unlock for access to all 60 flashcards in this deck.
Unlock Deck
k this deck
34
Which of the following statements best describes the distribution and variability of the histogram below? The data in the histogram summarizes length of time on hold for a collection of customers calling a repair call center.
A)The distribution shows that the data was highly variable with some callers waiting on hold as many as 20 minutes.
B)The distribution is left- skewed and most callers waited on hold at least three minutes.
C)The distribution is symmetrical. The number of callers who waited on hold for less than three minutes was the same as the number of callers who waited on hold for more than three minutes.
D)The distribution is right- skewed and most callers waited on hold less than three minutes.
Unlock Deck
Unlock for access to all 60 flashcards in this deck.
Unlock Deck
k this deck
35
The histogram below shows the distribution of pass rates on a swimming test of all children who completed a four week summer swim course at the local YMCA. How many of the courses had a pass rate less than 40 percent?
A)Not enough information available
B)About 5
C)About 3
D)About 8
A)Not enough information available
B)About 5
C)About 3
D)About 8
Unlock Deck
Unlock for access to all 60 flashcards in this deck.
Unlock Deck
k this deck
36
The distribution of the numbers of times individuals in the 18- 24 age group log onto a social networking website during the course of a day tends to be right- skewed.
A)
B)
C)
A)
B)
C)
Unlock Deck
Unlock for access to all 60 flashcards in this deck.
Unlock Deck
k this deck
37
In which category was there more variability apparent?
A)Graduated College, Bachelor's Degree
B)Graduated College, Associate's Degree
C)No College
D)Some College
A)Graduated College, Bachelor's Degree
B)Graduated College, Associate's Degree
C)No College
D)Some College
Unlock Deck
Unlock for access to all 60 flashcards in this deck.
Unlock Deck
k this deck
38
The graph below displays the number of applications for a concealed weapons permit in Montcalm County, Michigan, for each of three years. A reported interprets this graph to mean that applications in 2010 are more than twice the level in 2008. Is the reported making a correct interpretation?
A)Yes. The bar for 2010 is twice the height of the bar for 2008 and the number of applications indicated above the bars shows that applications in 2010 are more than twice the level in 2008.
B)No. Although the 2010 bar is more than twice the height of the 2008, the bars do not begin at 0 applications, so the graph does not correctly represent the data. Fifty- five is not equal to two times the number of applications made in 2008.
C)No. The width of the bars is identical, indicating that the number of applications in 2010 is no different from 2008.
Unlock Deck
Unlock for access to all 60 flashcards in this deck.
Unlock Deck
k this deck
39
The graph below displays the number of homicides in the city of Flint, Michigan for each of the last three years. A reported interprets this graph to mean that the number of murders in 2010 was more than twice the number of murders in 2008. Is the reporter making a correct interpretation?
A)No. The width of the bars is identical, indicating that the number of murders in 2010 is no different from 2008.
B)There is not enough information given in the graph to determine whether the reporter's interpretation is correct or not.
C)Yes. The bar for 2010 is twice the height of the bar for 2008 and the number of murders indicated above the bars confirms that murders in 2010 were more than twice the level in 2008.
Unlock Deck
Unlock for access to all 60 flashcards in this deck.
Unlock Deck
k this deck
40
Find the original data set from the stemplot given below.
A)45, 41, 45, 46, 42, 42, 43, 47, 40, 48, 49, 49, 49
B)450, 451, 455, 462, 463, 470, 478, 479
C)450, 450, 451, 455, 462, 462, 463
D)450, 450, 451, 455, 462, 462, 463, 470, 478, 479, 479, 479
A)45, 41, 45, 46, 42, 42, 43, 47, 40, 48, 49, 49, 49
B)450, 451, 455, 462, 463, 470, 478, 479
C)450, 450, 451, 455, 462, 462, 463
D)450, 450, 451, 455, 462, 462, 463, 470, 478, 479, 479, 479
Unlock Deck
Unlock for access to all 60 flashcards in this deck.
Unlock Deck
k this deck
41
Write a sentence to compare color preferences or males and females.
Unlock Deck
Unlock for access to all 60 flashcards in this deck.
Unlock Deck
k this deck
42
According to the histogram, about how many households do not own any cell phones?
Unlock Deck
Unlock for access to all 60 flashcards in this deck.
Unlock Deck
k this deck
43
According to the histogram, about how many households own four or more cell phones?
Unlock Deck
Unlock for access to all 60 flashcards in this deck.
Unlock Deck
k this deck
44
Compare and describe the shape of the distributions.
Unlock Deck
Unlock for access to all 60 flashcards in this deck.
Unlock Deck
k this deck
45
About what percentage of households own no more than three cell phones?
Unlock Deck
Unlock for access to all 60 flashcards in this deck.
Unlock Deck
k this deck
46
A used car salesman decides to track the number of cars he sold each week for the past twelve months. Typically, the salesman sells 13 cars per week. During an usually slow week he sold only 2 cars, but during his best week he sold 29 cars. Predict the shape of the histogram of the number of cars sold each week.
Unlock Deck
Unlock for access to all 60 flashcards in this deck.
Unlock Deck
k this deck
47
Describe the shape of the distribution in context?
Unlock Deck
Unlock for access to all 60 flashcards in this deck.
Unlock Deck
k this deck
48
Which type of take- out food is least popular? Is this easier to determine with the bar chart or with the pie chart? Why?
Unlock Deck
Unlock for access to all 60 flashcards in this deck.
Unlock Deck
k this deck
49
Did one group (males or females)show more variability in car color?
Unlock Deck
Unlock for access to all 60 flashcards in this deck.
Unlock Deck
k this deck
50
About what percent of girls spent 5 hours or less on extracurricular athletic activities each week? Round to the nearest whole percent.
Unlock Deck
Unlock for access to all 60 flashcards in this deck.
Unlock Deck
k this deck
51
What percentage of college students preferred either Chinese or pizza? Is this easier to determine with the bar chart or with the pie chart? Why?
Unlock Deck
Unlock for access to all 60 flashcards in this deck.
Unlock Deck
k this deck
52
Report the mode for males and females.
Unlock Deck
Unlock for access to all 60 flashcards in this deck.
Unlock Deck
k this deck
53
Define the important features to look for when presented with a numerical distribution.
Unlock Deck
Unlock for access to all 60 flashcards in this deck.
Unlock Deck
k this deck
54
The histograms below show the distribution of quiz scores on a ten point math quiz with and without a fifteen minute review before the quiz. Describe the different shapes of the distributions. Does it appear that the fifteen minute review resulted in improved quiz scores? Explain the evidence that supports your conclusion.
Unlock Deck
Unlock for access to all 60 flashcards in this deck.
Unlock Deck
k this deck
55
Which group is more likely to spend 8 hours or more on extracurricular athletic activities each week? Which group is more likely to spend 6 hours or less on extracurricular athletic activities each week?
Unlock Deck
Unlock for access to all 60 flashcards in this deck.
Unlock Deck
k this deck
56
Compare and contrast the important similarities and differences between bar charts and histograms. In what context should a bar chart be used? Explain why there are gaps between the bars on a bar chart. In what context should a histogram be used? Explain why there are no gaps between the bars on a histogram.
Unlock Deck
Unlock for access to all 60 flashcards in this deck.
Unlock Deck
k this deck
57
The library does not want patrons to wait in line. Usually, a line develops when a computer is used more than 40 times in a day. What percent of days did this occur? Round to the nearest whole percent.
Unlock Deck
Unlock for access to all 60 flashcards in this deck.
Unlock Deck
k this deck
58
You have created a histogram showing the distribution of the amount of money spent weekly on video game purchases of 120 males ages 19- 25 over the last 6 months. The histogram shows that the typical amount spent by males in this age category is $35. The histogram also shows that one male reported that he spent $250 dollars on video game purchases during one of the weeks. Explain how you would use the histogram to determine whether $250 is an outlier.
Unlock Deck
Unlock for access to all 60 flashcards in this deck.
Unlock Deck
k this deck
59
Explain how to assess variability when presented with categorical data.
Unlock Deck
Unlock for access to all 60 flashcards in this deck.
Unlock Deck
k this deck
60
About how many of the swim courses had a pass rate of 70% or better? The YMCA managers have set a goal for the summer that at least half the swim courses have a pass rate of at least 70%. Do you think that this YMCA is running a successful summer swim program? Why?
Unlock Deck
Unlock for access to all 60 flashcards in this deck.
Unlock Deck
k this deck
Unlock Deck
Unlock for access to all 60 flashcards in this deck.


