
A Visual Approach to SPSS for Windows 2nd Edition by Leonard Stern
النسخة 2الرقم المعياري الدولي: 978-0205706051A Visual Approach to SPSS for Windows 2nd Edition by Leonard Stern
النسخة 2الرقم المعياري الدولي: 978-0205706051 تمرين 1
Each cell of the table below shows values of a dependent variable for different groups of five participants who were randomly assigned to a cell of the factorial design formed from factors A and B each with two levels.
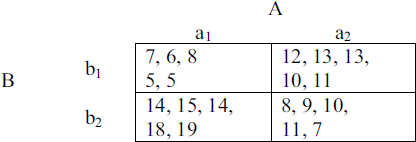
1. Enter the data into SPSS in a manner suitable for conducting a two-way ANOVA that assesses the effects of factors A and B on the mean values of the dependent variable.
2. Perform the two-way ANOVA. Include a line plot that shows levels of Factor A on the x-axis. Describe the outcome of the analysis.
التوضيح موثّق
موثّق
1.
Enter the data into SPSS as shown bel...
A Visual Approach to SPSS for Windows 2nd Edition by Leonard Stern
لماذا لم يعجبك هذا التمرين؟
أخرى 8 أحرف كحد أدنى و 255 حرفاً كحد أقصى
حرف 255


