
Intermediate Microeconomics and Its Application 12th Edition by Walter Nicholson,Christopher Snyder
النسخة 12الرقم المعياري الدولي: 978-1133189022Intermediate Microeconomics and Its Application 12th Edition by Walter Nicholson,Christopher Snyder
النسخة 12الرقم المعياري الدولي: 978-1133189022 تمرين 26
Use Figure to explain why a rise in the price of an input must increase the total cost of producing any given output level. What does this result suggest about how such a price increase shifts the AC curve? Do you think it is possible to draw any definite conclusion about how the MC curve would be affected?
Figure Minimizing the Costs of Producing q 1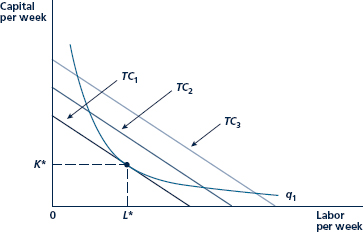
A firm is assumed to choose capital (K) and labor (L) to minimize total costs. The condition for this minimization is that the rate at which L can be substituted for K (while keeping q = q 1 ) should be equal to the rate at which these nputs can be traded in the market. In other words, the RTS (of L for K) should be set equal to the price ratio w/v. This tangency is shown here in that costs are minimized at TC1 by choosing inputs K* and L*.
التوضيح موثّق
موثّق
With reference to figure 7.1, a rise in ...
Intermediate Microeconomics and Its Application 12th Edition by Walter Nicholson,Christopher Snyder
لماذا لم يعجبك هذا التمرين؟
أخرى 8 أحرف كحد أدنى و 255 حرفاً كحد أقصى
حرف 255


