
College Algebra in Context with Applications for the Managerial, Life, and Social Sciences 3rd Edition by Ronald J Harshbarger, Lisa Yocco
النسخة 3الرقم المعياري الدولي: 032157060XCollege Algebra in Context with Applications for the Managerial, Life, and Social Sciences 3rd Edition by Ronald J Harshbarger, Lisa Yocco
النسخة 3الرقم المعياري الدولي: 032157060X تمرين 13
الحلول خطوة بخطوة موثّق
موثّق
الخطوة 1 من2
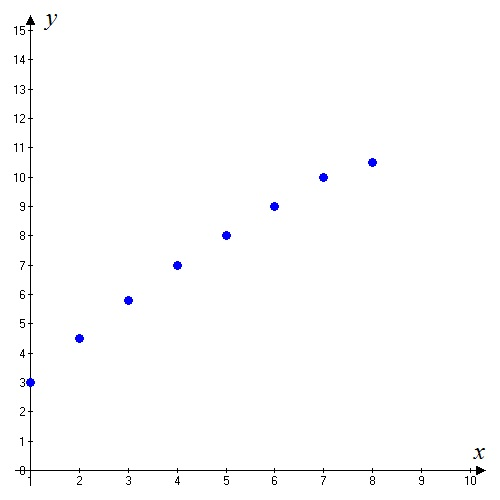
Consider the tabular values that fit a power function model as shown below:
| x | 1 | 2 | 3 | 4 | 5 | 6 | 7 | 8 |
| y | 3 | 4.5 | 5.8 | 7 | 8 | 9 | 10 | 10.5 |
Need to find the power function
Let the required power function model is of the form 
The constants  can be determined by using a graphing utility as shown below:
Step1: First plot a scatter plot for the given data points by using the table graph feature of the graphing utility on a window 
الخطوة 2 من 2
College Algebra in Context with Applications for the Managerial, Life, and Social Sciences 3rd Edition by Ronald J Harshbarger, Lisa Yocco
لماذا لم يعجبك هذا التمرين؟
أخرى 8 أحرف كحد أدنى و 255 حرفاً كحد أقصى
حرف 255


