
College Algebra in Context with Applications for the Managerial, Life, and Social Sciences 3rd Edition by Ronald J Harshbarger, Lisa Yocco
النسخة 3الرقم المعياري الدولي: 032157060XCollege Algebra in Context with Applications for the Managerial, Life, and Social Sciences 3rd Edition by Ronald J Harshbarger, Lisa Yocco
النسخة 3الرقم المعياري الدولي: 032157060Xالخطوة 1 من3
Consider the following function.

Where t denotes the number of years after 1960 and denotes the funds spent on educational programs.
(a) From the definition of the function it is obvious that the graph of the function is a straight line with the slope 1.965 and y-intercept -5.65 for the values of t between 5 and 20. The second part of the function
 will be a parabola open upwards (the function has positive coefficient for the second degree term) for the value of t between 20 and 40 because it is a second degree polynomial.
The graph of the function will be as shown in the following diagram.
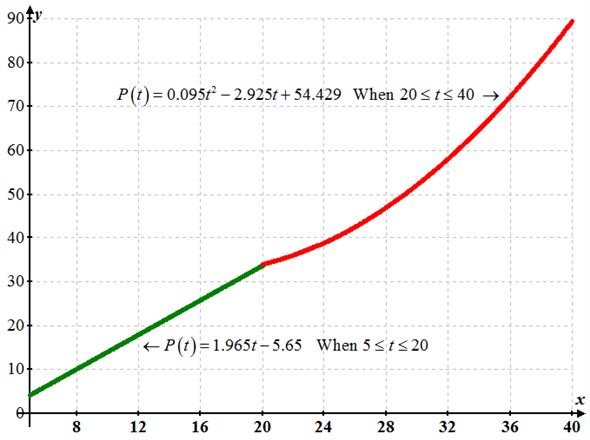
From the above graph it is observed that the funding for the educational programs from the year 1965 to 1985 increased at constant rate of 1.965 millions of dollars per year, the growth rate has been decreased for few years after 1985 and there is a rapid increase in the growth rate of fundings in last few years this because the second part of the function  is parabola open upwards.
Hence there is a constant growth rate in the funding is maintained for years between 1965 and 1980.
الخطوة 2 من 3
الخطوة 3 من 3
لماذا لم يعجبك هذا التمرين؟
أخرى


