
College Algebra in Context with Applications for the Managerial, Life, and Social Sciences 3rd Edition by Ronald J Harshbarger, Lisa Yocco
النسخة 3الرقم المعياري الدولي: 032157060XCollege Algebra in Context with Applications for the Managerial, Life, and Social Sciences 3rd Edition by Ronald J Harshbarger, Lisa Yocco
النسخة 3الرقم المعياري الدولي: 032157060X تمرين 61
الحلول خطوة بخطوة موثّق
موثّق
الخطوة 1 من2
Consider the quadratic function that models U.S. Population percentage for foreign born as shown below:
 , where
  is the number of years after 1900.
(a)
Verify the graphical solution one of the solution to the model  is
is .
.
Sketch the graph of the quadratic function :
:
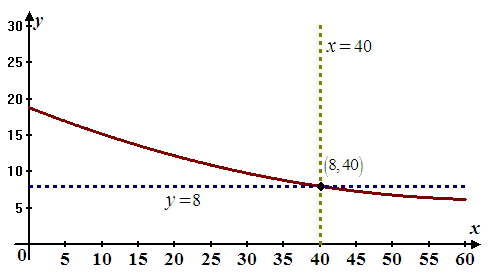
After sketching the graph , sketch the graph
  and
and  on the same window.
Both lines  and
and  intersect the graph
  at the point
 , which verifies the
  is the solution of the quadratic equation
 .
.
الخطوة 2 من 2
College Algebra in Context with Applications for the Managerial, Life, and Social Sciences 3rd Edition by Ronald J Harshbarger, Lisa Yocco
لماذا لم يعجبك هذا التمرين؟
أخرى 8 أحرف كحد أدنى و 255 حرفاً كحد أقصى
حرف 255


