
College Algebra in Context with Applications for the Managerial, Life, and Social Sciences 3rd Edition by Ronald J Harshbarger, Lisa Yocco
النسخة 3الرقم المعياري الدولي: 032157060XCollege Algebra in Context with Applications for the Managerial, Life, and Social Sciences 3rd Edition by Ronald J Harshbarger, Lisa Yocco
النسخة 3الرقم المعياري الدولي: 032157060X تمرين 36
الحلول خطوة بخطوة موثّق
موثّق
الخطوة 1 من4
(a)
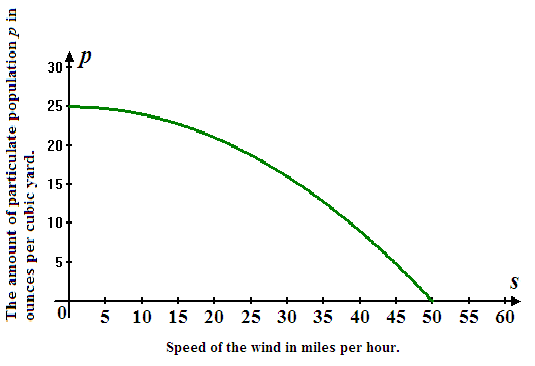
The relationship between  approximated by
 .
.
Here,  is in ounces per cubic yard and
  is in miles per hour.
Sketch the graph to the function for the non-negative values of
  .
.
الخطوة 2 من 4
الخطوة 3 من 4
الخطوة 4 من 4
College Algebra in Context with Applications for the Managerial, Life, and Social Sciences 3rd Edition by Ronald J Harshbarger, Lisa Yocco
لماذا لم يعجبك هذا التمرين؟
أخرى 8 أحرف كحد أدنى و 255 حرفاً كحد أقصى
حرف 255


