
College Algebra in Context with Applications for the Managerial, Life, and Social Sciences 3rd Edition by Ronald J Harshbarger, Lisa Yocco
النسخة 3الرقم المعياري الدولي: 032157060XCollege Algebra in Context with Applications for the Managerial, Life, and Social Sciences 3rd Edition by Ronald J Harshbarger, Lisa Yocco
النسخة 3الرقم المعياري الدولي: 032157060X تمرين 19
الحلول خطوة بخطوة موثّق
موثّق
الخطوة 1 من2
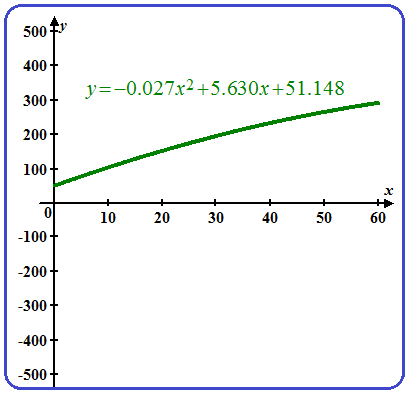
The number of arrests of juveniles per 100,000 juveniles for crimes is given by

Here is the number of years after 1950.
(a)
Need to graph the above function for the years1950-2010.
Let  corresponds to the year 1950.
Then graph the function for the years 0-60.
Plot the graph of the function for as shows below:
الخطوة 2 من 2
College Algebra in Context with Applications for the Managerial, Life, and Social Sciences 3rd Edition by Ronald J Harshbarger, Lisa Yocco
لماذا لم يعجبك هذا التمرين؟
أخرى 8 أحرف كحد أدنى و 255 حرفاً كحد أقصى
حرف 255


