
College Algebra in Context with Applications for the Managerial, Life, and Social Sciences 3rd Edition by Ronald J Harshbarger, Lisa Yocco
النسخة 3الرقم المعياري الدولي: 032157060XCollege Algebra in Context with Applications for the Managerial, Life, and Social Sciences 3rd Edition by Ronald J Harshbarger, Lisa Yocco
النسخة 3الرقم المعياري الدولي: 032157060X تمرين 59
الحلول خطوة بخطوة موثّق
موثّق
الخطوة 1 من10
Consider the data the average length of stay in noninstitutional, short-stay hospital for selected years as follows.
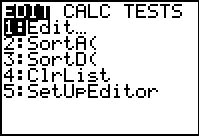
Press stat to view the statistics calculation options.
Press stat to view the statistics calculation options.
First press and select the
 option by pressing 1 from the displayed menu.
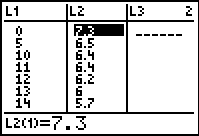
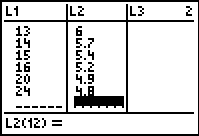
Next, enter the each y value in L1 followed by pressing the enter key and enter the corresponding x value in L2 followed by pressing the enter key.
The output will be displayed as shown:
Press 2nd graph to view the table
الخطوة 2 من 10
الخطوة 3 من 10
الخطوة 4 من 10
الخطوة 5 من 10
الخطوة 6 من 10
الخطوة 7 من 10
الخطوة 8 من 10
الخطوة 9 من 10
الخطوة 10 من 10
College Algebra in Context with Applications for the Managerial, Life, and Social Sciences 3rd Edition by Ronald J Harshbarger, Lisa Yocco
لماذا لم يعجبك هذا التمرين؟
أخرى 8 أحرف كحد أدنى و 255 حرفاً كحد أقصى
حرف 255


