
College Algebra in Context with Applications for the Managerial, Life, and Social Sciences 3rd Edition by Ronald J Harshbarger, Lisa Yocco
النسخة 3الرقم المعياري الدولي: 032157060XCollege Algebra in Context with Applications for the Managerial, Life, and Social Sciences 3rd Edition by Ronald J Harshbarger, Lisa Yocco
النسخة 3الرقم المعياري الدولي: 032157060X تمرين 26
الحلول خطوة بخطوة موثّق
موثّق
الخطوة 1 من5
Consider the table,
| x | 5 | 8 | 11 | 14 | 17 | 20 |
| y | 7 | 14 | 20 | 28 | 36 | 43 |
Need to create a linear model for the data:
Draw the scatter diagram by using graphing calculator
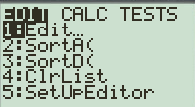
Need to use the following operation to make the table.
Press  and
and  (or
(or ) to enter Stat Edit mode
The display is as shown below.
الخطوة 2 من 5
الخطوة 3 من 5
الخطوة 4 من 5
الخطوة 5 من 5
College Algebra in Context with Applications for the Managerial, Life, and Social Sciences 3rd Edition by Ronald J Harshbarger, Lisa Yocco
لماذا لم يعجبك هذا التمرين؟
أخرى 8 أحرف كحد أدنى و 255 حرفاً كحد أقصى
حرف 255


