Table 5.2 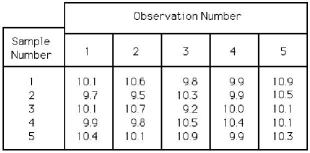
-Using Table 5.2,the sample values represent service times in minutes.For the R-chart,what is the value of UCLR?
A) less than or equal to 0.90
B) greater than 0.90 but less than or equal to 0.99
C) greater than 0.99 but less than or equal to 1.99
D) greater than 1.99
Correct Answer:
Verified
Q88: The underlying statistical distribution for the p-chart
Q104: Historically,the average diameter of the holes drilled
Q105: Historically,the average diameter of the holes drilled
Q105: The consultant suspiciously eyed the c-chart that
Q107: Historically,the average time to service a customer
Q108: Five samples of size 4 were taken
Q110: Table 5.1
Factors for Calculating Three-Sigma Limits for
Q113: Historically,the average time to service a customer
Q114: A company is interested in monitoring the
Q117: Which alternative will increase the probability of
Unlock this Answer For Free Now!
View this answer and more for free by performing one of the following actions

Scan the QR code to install the App and get 2 free unlocks

Unlock quizzes for free by uploading documents