The scatterplots below show the relation between the average phenotype of parents (x-axis) and that of their offspring (y-axis) for three traits. One trait has a heritability of 90% (comparable to that of fingerprint ridge count) , another has a heritability of 50% (comparable to that of human height) , and yet another has a heritability of 25% (comparable to that of human longevity) . To make the axes comparable, for each trait the phenotypic measurement is expressed as a deviation from the overall mean in multiples of the standard deviation.
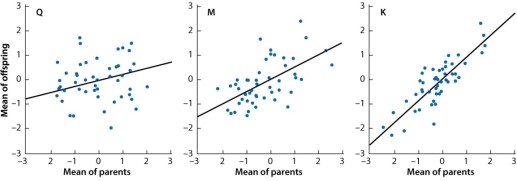 The fact that all of the lines slope upward means that:
A) variation in each trait is affected by differences in heredity.
B) variation in each trait is affected by environmental differences.
C) the genes affecting any one trait have no effect on any other trait.
D) some genes affect all three traits.
E) the traits all show genotype-by-environment interaction.
Correct Answer:
Verified
Q58: Genetic differences are always more important than
Q59: Which of the traits depicted here has
Q60: Similar to single gene traits, traits determined
Q61: In the graph of Galton's height data
Q62: After reviewing the graph below, one could
Q64: In the graph of Galton's height data
Q65: Which line on the graph below demonstrates
Q66: Heritability is a measure of the:
A)extent to
Q67: Heritability is the proportion of the total
Q68: Nilsson-Ehle's studies of seed color in wheat
Unlock this Answer For Free Now!
View this answer and more for free by performing one of the following actions

Scan the QR code to install the App and get 2 free unlocks

Unlock quizzes for free by uploading documents