In the graph shown here, the dashed line shows the level of mRNA for a certain protein, Prot6, at various positions along the anterior-posterior axis of an insect embryo. The solid lines portray the levels of two regulatory proteins, A and B, that control translation of the Prot6 mRNA. 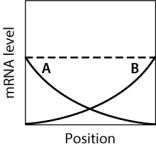 If both A and B stimulate translation of the Prot6 mRNA, then which graph BEST approximates the expected level of Prot6 across the embryo?
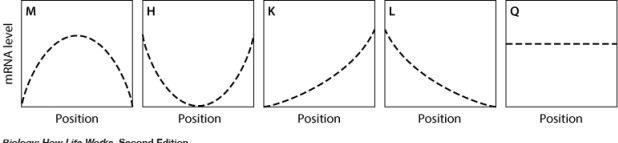
A) graph M
B) graph H
C) graph K
D) graph L
E) graph Q
Correct Answer:
Verified
Q57: Which of the following transcriptional regulators prevents
Q58: Cells become differentiated when certain subsets of
Q59: In human development, early divisions of the
Q60: The fertilized egg is totipotent, whereas the
Q61: The reason scientists hope to develop personalized
Q63: The Bithorax mutation in Drosophila results in
Q64: In Drosophila, absence of Bicoid protein results
Q65: In the graph shown here, the dashed
Q66: A new mutation is discovered in Drosophila
Q67: In the graph shown here, the dashed
Unlock this Answer For Free Now!
View this answer and more for free by performing one of the following actions

Scan the QR code to install the App and get 2 free unlocks

Unlock quizzes for free by uploading documents