Refer to the following table when answering the following questions.
Table 4.1: Production Model's Prediction for Per Capita GDP (US = 1) 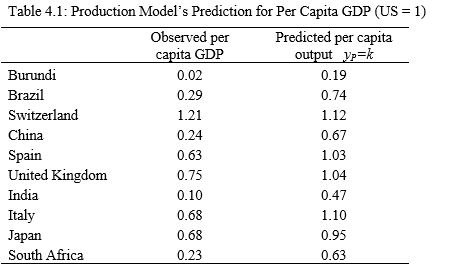 (Source: Penn World Tables 9.0)
-Considering the data in Table 4.1, the explanation for the difference between the predicted and actual level of output is called ________. If you compare South Africa's observed and predicted output, this difference is equal to ________.
A) total factor productivity; 0.37
B) the Solow residual; 2.71
C) Dirac's delta; 0.14
D) capital's share of GDP; one-third
E) labor's share of GDP; two-thirds
Correct Answer:
Verified
Q61: The equation Q62: As an economist working at the International Q63: Refer to the following table when answering Q64: As a measure for total factor productivity, Q65: In the Cobb-Douglas production function Q67: As an economist working at the International Q68: Differences in output across economies with the Q69: Refer to the following table when answering Q70: In the equation Q71: Refer to the following table when answering![]()

![]()
Unlock this Answer For Free Now!
View this answer and more for free by performing one of the following actions

Scan the QR code to install the App and get 2 free unlocks

Unlock quizzes for free by uploading documents