A graphical representation of a linear program is shown below. The shaded area represents the feasible region, and the dashed line in the middle is the slope of the objective function. 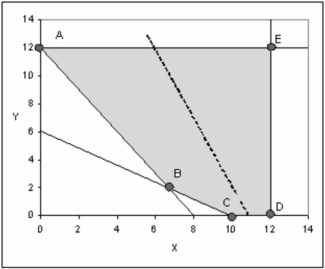
If this is a minimization, which extreme point is the optimal solution?
Correct Answer:
Verified
Q55: Consider the following minimization problem:
Min z =
Q56: The _ property of linear programming models
Q57: The _ step in formulating a linear
Q58: The _ property of linear programming models
Q59: The _ property of linear programming models
Q61: Consider the following linear programming problem:
MIN Z
Q62: A graphical representation of a linear program
Q63: In a linear programming problem, a valid
Q64: Consider the following linear programming problem:
MIN Z
Q65: The minimization of cost or maximization of
Unlock this Answer For Free Now!
View this answer and more for free by performing one of the following actions

Scan the QR code to install the App and get 2 free unlocks

Unlock quizzes for free by uploading documents