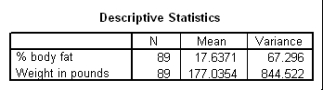
The following scatter plot and SPSS output represent data collected on 89 middle-aged people.The relationship between body weight and percent body fat is to be studied. 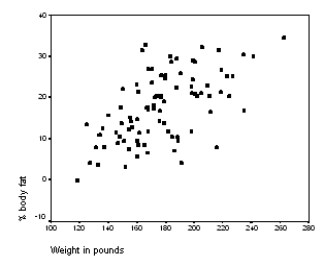
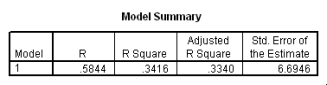
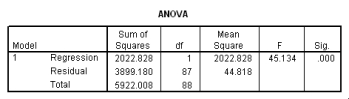
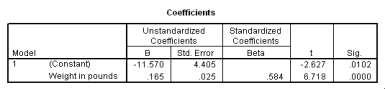 Let be the population correlation between body fat and body weight.What is the value of the t statistic for testing the hypotheses H0: = 0 versus Ha: 0?
Correct Answer:
Verified
Q59: A recent study was done to assess
Q60: A recent study was done to assess
Q61: The following scatter plot and SPSS
Q62: The following scatter plot and SPSS output
Q63: A study was conducted to monitor the
Q65: In the National Football League (NFL),having
Q66: In the National Football League (NFL),having an
Q67: A recent study was done to assess
Q68: The following scatter plot and SPSS output
Q69: A recent study was done to assess
Unlock this Answer For Free Now!
View this answer and more for free by performing one of the following actions

Scan the QR code to install the App and get 2 free unlocks

Unlock quizzes for free by uploading documents