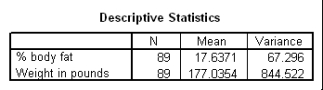
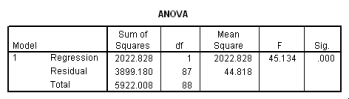
The following scatter plot and SPSS output represent data collected on 89 middle-aged people.The relationship between body weight and percent body fat is to be studied. 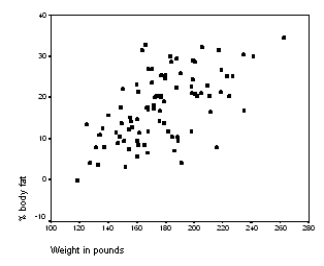
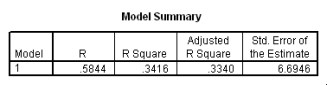
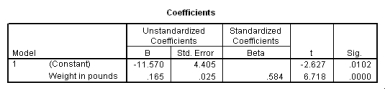 What is the value of the correlation between body fat and body weight?
Correct Answer:
Verified
Q66: In the National Football League (NFL),having an
Q67: A recent study was done to assess
Q68: The following scatter plot and SPSS output
Q69: A recent study was done to assess
Q70: A study was conducted to monitor the
Q72: A study was conducted to monitor the
Q73: A study was conducted to monitor
Q74: A study was conducted to monitor the
Q75: In the National Football League (NFL),having an
Q76: For the 2009 NFL season,data are
Unlock this Answer For Free Now!
View this answer and more for free by performing one of the following actions

Scan the QR code to install the App and get 2 free unlocks

Unlock quizzes for free by uploading documents