The following Excel scatterplot with the fitted quadratic regression equation illustrates the observed relationship between productivity and the number of hired workers. 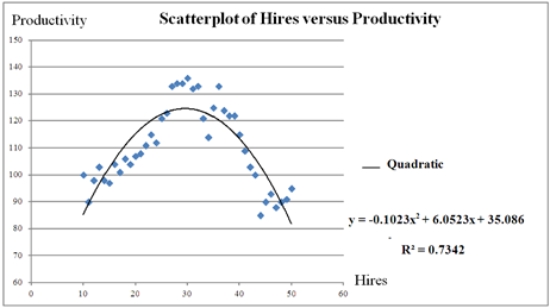 Assuming that the number of hired workers must be an integer,what is the maximum productivity to achieve?
A) 29.58
B) 30.00
C) 124.603
D) 124.585
Correct Answer:
Verified
Q40: The following Excel scatterplot with the fitted
Q41: Typically,the sales volume declines with an increase
Q42: Typically,the sales volume declines with an increase
Q44: Typically,the sales volume declines with an increase
Q46: Typically,the sales volume declines with an increase
Q47: The coefficient of determination R2 cannot be
Q47: Typically,the sales volume declines with an increase
Q49: For which of the following models,the formula
Q50: Given the data on y and x,what
Q54: When the predicted value of the response
Unlock this Answer For Free Now!
View this answer and more for free by performing one of the following actions

Scan the QR code to install the App and get 2 free unlocks

Unlock quizzes for free by uploading documents