The following Excel scatterplot with the fitted quadratic regression equation illustrates the observed relationship between productivity and the number of hired workers. 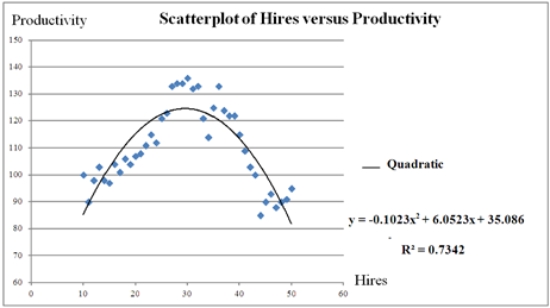 Assuming that the number of hired workers must be integer,how many workers should be hired to achieve the highest productivity?
A) 26
B) 28
C) 30
D) 32
Correct Answer:
Verified
Q43: For the exponential model ln(y) = β0
Q54: For the logarithmic model ln(y)= β0 +
Q55: For the log-log model ln(y)= β0 +
Q56: Typically,the sales volume declines with an increase
Q58: A model in which the response variable
Q60: A model with one explanatory variable being
Q61: The following data,with the corresponding Excel scatterplot,show
Q62: The following data show the demand for
Q63: The following data show the demand for
Q64: The following data,with the corresponding Excel scatterplot,show
Unlock this Answer For Free Now!
View this answer and more for free by performing one of the following actions

Scan the QR code to install the App and get 2 free unlocks

Unlock quizzes for free by uploading documents