The following Excel scatterplot with the fitted quadratic regression equation illustrates the observed relationship between productivity and the number of hired workers. 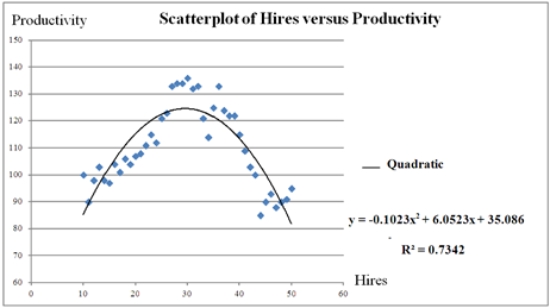 For which value of Hires is the predicted Productivity maximized? Note: Do not round to the nearest integer.
A) 29.58
B) 124.60
C) 35.086
D) 27.34
Correct Answer:
Verified
Q26: For the quadratic regression equation 
Q27: The log-log and the _ models can
Q28: Although a polynomial regression model of order
Q28: How many coefficients need to be estimated
Q29: To compute the coefficient of determination R2
Q30: Which of the following is a quadratic
Q33: What is the effect of b2 <
Q34: Which of the following regression models is
Q36: The logarithmic model is especially attractive when
Q37: An inverted U-shaped curve is also known
Unlock this Answer For Free Now!
View this answer and more for free by performing one of the following actions

Scan the QR code to install the App and get 2 free unlocks

Unlock quizzes for free by uploading documents