Essay
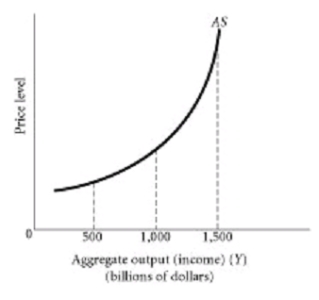
-Using the graph above, at aggregate output levels above $1500 billion what is happening to both costs and prices?
Correct Answer:
Verified
In this region costs...
View Answer
Unlock this answer now
Get Access to more Verified Answers free of charge
Related Questions
Q11: If input prices are increasing at the
Q12: What is the macroeconomic equilibrium price level?
Q13: The reaction of firms to an expansion
Q14: Q15: Explain why the aggregate supply curve is Q17: Explain what the aggregate supply curve represents. Unlock this Answer For Free Now! View this answer and more for free by performing one of the following actions Scan the QR code to install the App and get 2 free unlocks Unlock quizzes for free by uploading documents![]()

