In Figure 17-4, below, initial demand, marginal cost, and marginal revenue curves (none of them shown) caused the firm to produce the profit-maximizing quantity Y0 at a price of P0. Now the demand and marginal cost curves have moved to those shown, with the marginal revenue curve running through point L.
Figure 17-4 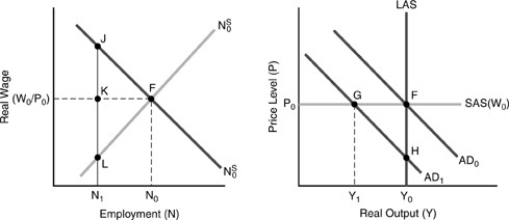
-If the firm in the figure above maintains its set price of P0, rather than dropping price to P1, this reduces its profit by
A) K - G.
B) K + G.
C) G - K.
D) G + H.
E) G.
Correct Answer:
Verified
Q45: The flaw of the Real Business Cycle
Q118: The flaw of the original Keynesian model
Q142: Initially a firm pays a wage and
Q145: Suppose that nominal aggregate demand falls by
Q146: The central idea distinguishing the "efficiency wage
Q149: Initially a firm pays a wage and
Q151: About what percentage of the U.S.labor force
Q152: Because efficiency wage theory deals with the
Q156: In Figure 17-4, below, initial demand, marginal
Q158: If all firms are paying efficiency wages
Unlock this Answer For Free Now!
View this answer and more for free by performing one of the following actions

Scan the QR code to install the App and get 2 free unlocks

Unlock quizzes for free by uploading documents