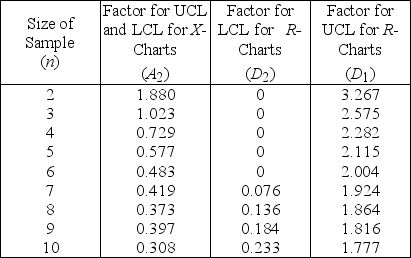
Table 6.1
Factors for Calculating Three-Sigma Limits for the  -chart and R-chart
 Source: 1950 Manual on Quality Control of Materials,copyright
American Society for Testing Materials.Reprinted with permission.
-A milling operation has historically produced an average thickness of 0.005 inch with an average range of 0.015 inch.Currently,the first three items from each batch of 20 are inspected.Use Table 6.1.What is the value of the LCL  ?
?
A) less than or equal to 0.00100
B) greater than 0.00100 but less than or equal to 0.00299
C) greater than 0.00299 but less than or equal to 0.00499
D) greater than 0.00499
Correct Answer:
Verified
Q83: An operator of a filling machine plotted
Q86: Which one of the following statements relating
Q94: When should complete inspection be used?
A) when
Q95: In SPC, the distribution of sample means:
A)
Q132: Historically,the average time to service a customer
Q133: Historically,the average time to service a customer
Q135: Table 6.1
Factors for Calculating Three-Sigma Limits for
Q136: A company is interested in monitoring the
Q137: A company is interested in monitoring the
Q138: The central line on a p-chart is
Unlock this Answer For Free Now!
View this answer and more for free by performing one of the following actions

Scan the QR code to install the App and get 2 free unlocks

Unlock quizzes for free by uploading documents