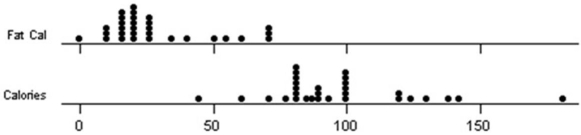
A team of introductory statistics students went to a grocery store and recorded the total calories and fat calories for various kinds of soup.They produced a table of statistics and two dot plots.Write a succinct summary of the center,variability,and shape for each data set.Note: TrimMean is the 5 percent trimmed mean (removing the smallest 5 percent and the largest 5 percent of the values,rounded to the nearest integer).

Correct Answer:
Verified
View Answer
Unlock this answer now
Get Access to more Verified Answers free of charge
Q126: In Osaka, Japan, stock brokers earn ×6000
Q129: Eleven students were asked how many siblings
Q138: The mean of a population is 50
Q139: If Q1 = 150 and Q3 =
Q141: Briefly describe these data.Sketch its box plot
Q143: Below are the ages of 21 CEOs.Find
Q144: Briefly describe this sample of departure delays
Q145: A survey of 10 randomly chosen drivers
Q146: Craig operates a part-time snow-plowing business using
Q147: Here are descriptive statistics from Excel for
Unlock this Answer For Free Now!
View this answer and more for free by performing one of the following actions

Scan the QR code to install the App and get 2 free unlocks

Unlock quizzes for free by uploading documents