What does the graph below (profit/sales ratios for 25 Fortune 500 companies) reveal? 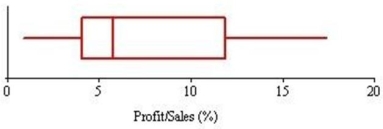
A) That the median exceeds the mean.
B) That the data are slightly left-skewed.
C) That the interquartile range is about 8.
D) That the distribution is bell-shaped.
Correct Answer:
Verified
Q71: Frieda is 67 inches tall and weighs
Q98: Twelve randomly chosen students were asked how
Q101: Here are statistics on order sizes of
Q101: A reporter for the campus paper asked
Q103: The following table is the frequency distribution
Q106: The following frequency distribution shows the amount
Q108: Craig operates a part-time snow-plowing business using
Q110: Five homes were recently sold in Oxnard
Q112: Find the standard deviation of this sample:
Q114: In Tokyo, construction workers earn an average
Unlock this Answer For Free Now!
View this answer and more for free by performing one of the following actions

Scan the QR code to install the App and get 2 free unlocks

Unlock quizzes for free by uploading documents