What type of graph is shown below? 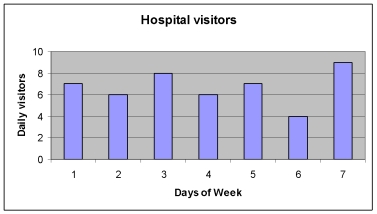
A) Frequency polygon
B) Stacked histogram
C) Simple histogram
D) Frequency distribution
Correct Answer:
Verified
Q1: The following figure is drawn from Schoenborn,
Q2: I collected some data about how much
Q3: What conclusion can be drawn from the
Q4: What does this graph tell you about
Q4: Which of the following does a box-whisker
Q5: What conclusion can be drawn from the
Q7: What statement best describes what is shown
Q8: What could be done to make the
Q9: Which of the following is not recommended
Q10: What does the information in the following
Unlock this Answer For Free Now!
View this answer and more for free by performing one of the following actions

Scan the QR code to install the App and get 2 free unlocks

Unlock quizzes for free by uploading documents