Each of the panels given below represents the short-run equilibrium in the U.S.economy.The Aggregate Demand and Aggregate Supply curves in each panel responds to various economic changes. Figure 8.1 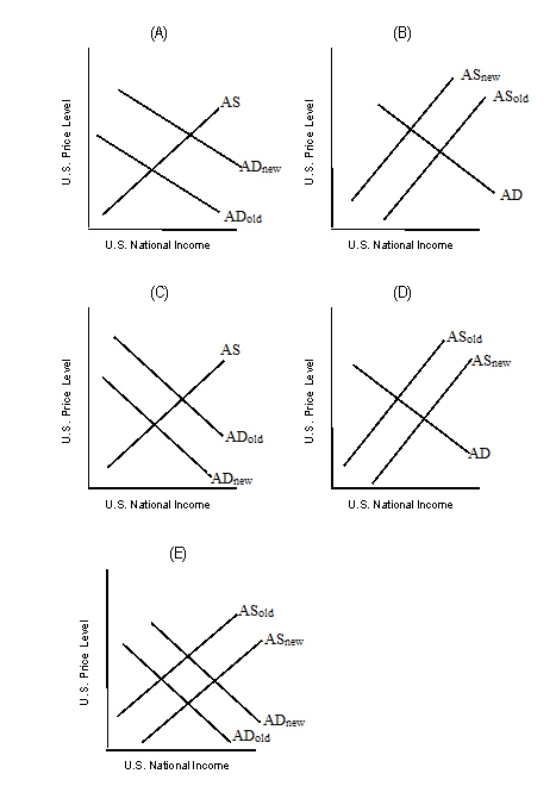 Refer to Figure 8.1.Which of the graphs in the figure best describes the impact of an effective oil embargo that raises the price of gasoline?
A) Panel A
B) Panel B
C) Panel C
D) Panel D
E) Panel E
Correct Answer:
Verified
Q57: The short-run aggregate supply curve will shift
Q58: Long-run aggregate supply increases as:
A)new production technology
Q59: The positive slope of the AS curve
Q60: As the level of real GDP increases,
Q61: Each of the panels given below represents
Q63: Assume that the aggregate demand increases while
Q64: Assume that the AD curve is held
Q65: Other things equal, an increase in aggregate
Q66: Identify the correct statement.
A)Aggregate demand alone determines
Q67: To determine short-run equilibrium in the economy,
Unlock this Answer For Free Now!
View this answer and more for free by performing one of the following actions

Scan the QR code to install the App and get 2 free unlocks

Unlock quizzes for free by uploading documents