The figure given below represents the consumption function of a country. Figure 9.3 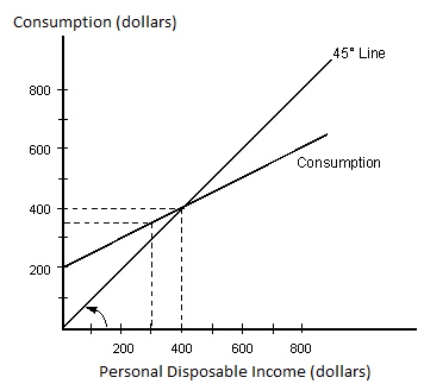 According to Figure 9.3, saving is zero when disposable income is _____.
A) $0
B) $400
C) $250
D) $800
E) $300
Correct Answer:
Verified
Q23: Suppose total disposable income in Country X
Q24: If a household experiences a $880 increase
Q25: A change in the marginal propensity to
Q26: The figure given below represents the consumption
Q27: As disposable income rises:
A)consumption falls as a
Q29: If a household's disposable income increases from
Q30: The figure given below shows the consumption
Q31: The table given below reports the consumption
Q32: The sum of the MPC and the
Q33: The table given below reports the consumption
Unlock this Answer For Free Now!
View this answer and more for free by performing one of the following actions

Scan the QR code to install the App and get 2 free unlocks

Unlock quizzes for free by uploading documents