The following graph shows the demand and cost curves of an imperfectly competitive firm.MC and ATC represent the marginal cost curve and the average cost curve respectively. Figure 22.1 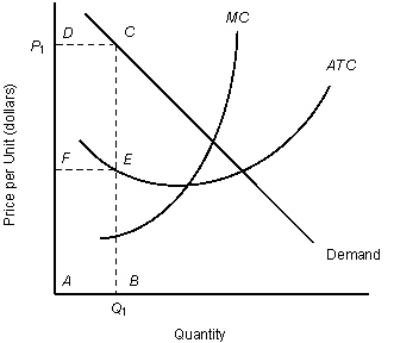 According to Figure 22.1, what is the firm's profit when it sells quantity Q1 at price P1?
A) Rectangle ABCD
B) Rectangle DCEF
C) Rectangle ABEF
D) Distance AB
E) Distance FD
Correct Answer:
Verified
Q23: A firm enjoys a positive economic profit
Q28: If a firm's marginal revenue is greater
Q32: The table given below reports the marginal
Q37: The table given below reports the marginal
Q39: The table given below reports the marginal
Q43: The figure given below shows the revenue
Q44: The figure given below shows the cost
Q45: The figure given below shows the revenue
Q47: The figure given below shows the revenue
Q60: Under perfect competition,at the profit maximizing level
Unlock this Answer For Free Now!
View this answer and more for free by performing one of the following actions

Scan the QR code to install the App and get 2 free unlocks

Unlock quizzes for free by uploading documents