How many values are in the data set whose histogram is shown below ? 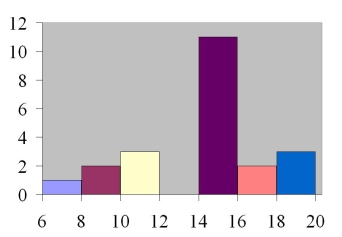
A) 6
B) 22
C) 76
D) 72
Correct Answer:
Verified
Q46: A time series graph is useful for
Q47: Construct a pie chart for the following
Q48: A Pareto chart does not have which
Q49: The percentages of white, wheat, and rye
Q51: The following information shows the colors of
Q53: Karen is constructing a pie graph to
Q54: Which graph should be used to represent
Q55: A local fundraiser wants to graphically display
Q60: If the graph of a frequency distribution
Q96: A time series graph represents data that
Unlock this Answer For Free Now!
View this answer and more for free by performing one of the following actions

Scan the QR code to install the App and get 2 free unlocks

Unlock quizzes for free by uploading documents