Electrocardiographs (ECGs or EKGs) provide data about the electrical activity of the heart. By placing a series of "leads" on a person's chest, the electrical activity of the heart can be recorded and analyzed in order to detect irregular heartbeats (arrhythmias) and other conditions. The figure below shows a normal EKG tracing for one cardiac cycle.
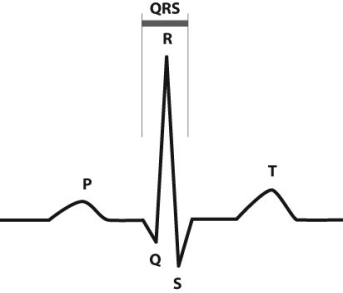 The P region represents electrical activity spreading through the atria. The QRS region represents electrical activity spreading through the ventricles. The T region represents electrical activity in the ventricles returning to rest.
-What is happening in the heart during the QRS region?
A) The atria are filling with blood.
B) The ventricles are filling with blood.
C) The atria are contracting.
D) The ventricles are contracting.
Correct Answer:
Verified
Q64: In which part of this figure would
Q65: To evaluate cardiac function, scientists and physicians
Q66: Which part of this figure depicts a
Q67: To evaluate cardiac function, scientists and physicians
Q68: You are taking someone's blood pressure and
Q70: To evaluate cardiac function, scientists and physicians
Q71: To evaluate cardiac function, scientists and physicians
Q72: To evaluate cardiac function, scientists and physicians
Q73: The anterior interventricular artery supplies a portion
Q74: Which of the following describes the stage
Unlock this Answer For Free Now!
View this answer and more for free by performing one of the following actions

Scan the QR code to install the App and get 2 free unlocks

Unlock quizzes for free by uploading documents