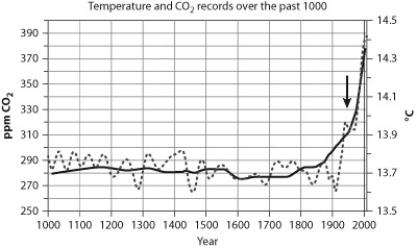
 The graph shows records of temperature (light gray line) and CO2 (dark gray line) over the past 1,000 years. CO2 is recorded in parts per million (ppm) .
-If the trends shown in the graph continue, how might this affect photosynthesis?
A) Photorespiration may increase, leading to an increase in photosynthetic production of sugar.
B) Photorespiration may increase, leading to a decrease in photosynthetic production of sugar.
C) C4 and CAM plants would be unable to photosynthesize.
D) There would be no effect on photorespiration, since CO2 and temperature are stable.
Correct Answer:
Verified
Q73: Chlorophyll is located in _, which are
Q74: In this drawing of a chloroplast, which
Q75: Atrazine is a widely used herbicide that
Q76: According to this figure, how do hydrogen
Q77: Put the following steps of the Calvin
Unlock this Answer For Free Now!
View this answer and more for free by performing one of the following actions

Scan the QR code to install the App and get 2 free unlocks

Unlock quizzes for free by uploading documents