Suppose the graph shows the energy usage in megawatts for one day for a large university campus. The daily energy consumption for the campus is measured in megawatt-hours and is found by calculating the area of the region between the graph and the horizontal axis. Estimate, to the nearest 10 megawatt-hours, the daily energy consumption using eight right rectangles. 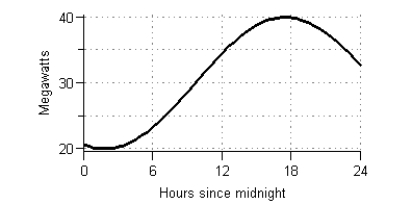
A) 760 megawatt-hours
B) 730 megawatt-hours
C) 830 megawatt-hours
D) 790 megawatt-hours
E) 1050 megawatt-hours
Correct Answer:
Verified
Q4: Scientists can model the change in snow
Q5: Suppose the graph shows the energy usage
Q6: Using data from the U.S. Bureau of
Q7: Consider the graph of r(t), the rate
Q8: Suppose the rate of change of the
Q10: The function Q11: A program to protect a species of Q12: Consider the graph of f(t). Q13: The graph of Q14: Suppose the rate of change of the![]()

![]()
Unlock this Answer For Free Now!
View this answer and more for free by performing one of the following actions

Scan the QR code to install the App and get 2 free unlocks

Unlock quizzes for free by uploading documents