A small percent of homes in an region lack certain amenities. The data is given in the table below. Give the linear model of the best fitting line  , where x is the number of years since 1984.
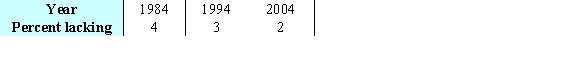
A) 
B) 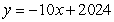
C) 
D) 
E) 
Correct Answer:
Verified
Q17: Test for relative maxima and minima.
Q18: Suppose table shows the average price of
Q19: A nursery sells mulch by the truckload.
Q20: Test for relative maxima and minima.
Q21: A travel agency offers spring-break cruise packages.
Q23: Write the Lagrange system of partial derivative
Q24: Locate the optimal point of the constrained
Q25: The daily output at a plant manufacturing
Q26: Let Q27: Let ![]()
![]()
Unlock this Answer For Free Now!
View this answer and more for free by performing one of the following actions

Scan the QR code to install the App and get 2 free unlocks

Unlock quizzes for free by uploading documents