The boxplots below show the closing share prices for a sample of companies on the first trading days in August 2007 and in August 2002. 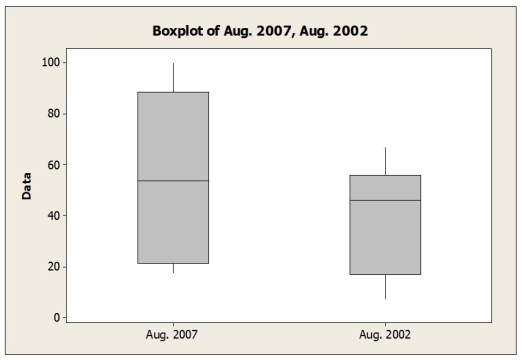 a. For which day was the median closing share price higher?
b. For which day were the closing share prices more variable? Explain.
c. Which distribution is more symmetric? Explain.
Correct Answer:
Verified
b. Aug. 2007; the...
View Answer
Unlock this answer now
Get Access to more Verified Answers free of charge
Q4: Consider the following to answer the question(s)
Q11: Below is a time series graph for
Q13: Consider the following to answer the question(s)
Q14: Data were collected on the hourly wage
Q17: Below is the five number summary of
Q18: Consider the following to answer the question(s)
Q18: The table below shows data on total
Q19: Consider the following to answer the question(s)
Q20: Below is the five-number summary of salaries
Q21: If a distribution for a quantitative variable
Unlock this Answer For Free Now!
View this answer and more for free by performing one of the following actions

Scan the QR code to install the App and get 2 free unlocks

Unlock quizzes for free by uploading documents