Figure 9-4. The figure shows a utility function for Dexter.
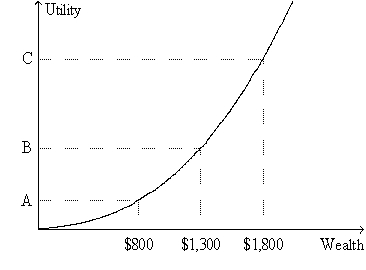
-Refer to Figure 9-4. In what way(s) does the graph differ from the usual case?
A) The utility function shown here is upward-sloping, whereas in the usual case the utility function is downward-sloping.
B) The utility function shown here is bowed downward (convex) , whereas in the usual case the utility function is bowed upward (concave) .
C) On the graph shown here, wealth is measured along the horizontal axis, whereas in the usual case saving is measured along the horizontal axis.
D) On the graph shown here, utility is measured along the vertical axis, whereas in the usual case satisfaction is measured along the vertical axis.
Correct Answer:
Verified
Q23: From the standpoint of the economy as
Q39: Diversification of a portfolio
A)can eliminate market risk,but
Q40: As the number of stocks in a
Q200: Figure 9-1. The figure shows a utility
Q201: Figure 9-3. The figure shows a utility
Q202: Figure 9-2. The figure shows a utility
Q203: Figure 9-4. The figure shows a utility
Q206: Figure 9-4. The figure shows a utility
Q209: Figure 9-2. The figure shows a utility
Q210: Figure 9-2. The figure shows a utility
Unlock this Answer For Free Now!
View this answer and more for free by performing one of the following actions

Scan the QR code to install the App and get 2 free unlocks

Unlock quizzes for free by uploading documents