Multiple Choice
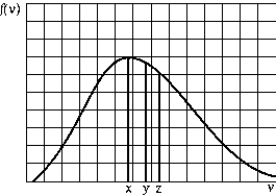 The graph shows the Maxwell-Boltzmann distribution function of the number of gas molecules per unit speed range at a given temperature. The average speed, the most probable speed, and the rms speed (in this order) are most likely given by
A) x, y, z
B) z, x, y
C) y, z, x
D) y, x, z
E) z, y, x
Correct Answer:
Verified
Related Questions
Q63: Use the following to answer the question:
Q72: Use the following to answer the question:
Q74: If the rms speed of nitrogen molecules
Q75: A 1 L container contains O2

