To approximate the width of a class in the creation of a bar chart,we may use this formula: 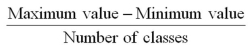 .
.
Correct Answer:
Verified
Q2: A bar chart depicts the frequency or
Q8: When constructing a scatterplot for two quantitative
Q10: For quantitative data,a cumulative frequency distribution records
Q13: Frequency distributions may be used to describe
Q14: For quantitative data, a cumulative relative frequency
Q15: An ogive is a graph that plots
Q16: A frequency distribution for qualitative data groups
Q18: In order to summarize qualitative data,a useful
Q20: A polygon connects a series of neighboring
Q30: For both qualitative and quantitative data, what
Unlock this Answer For Free Now!
View this answer and more for free by performing one of the following actions

Scan the QR code to install the App and get 2 free unlocks

Unlock quizzes for free by uploading documents