Exhibit 16.5.The following data shows the demand for an airline ticket dependent on the price of this ticket. 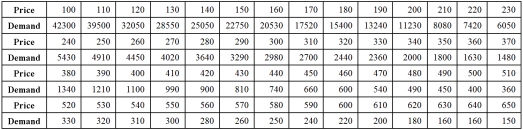 For the assumed cubic and log-log regression models,Demand = β0 + β1Price + β2Price2 + β3Price3 + ε and ln(Demand) = β0 + β1ln(Price) + ε,the following regression results are available:
 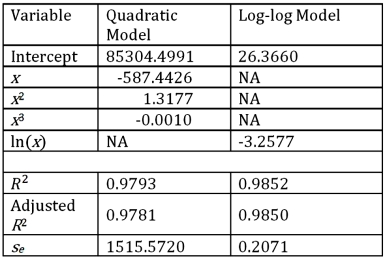 Refer to Exhibit 16.5.Assuming that the sample correlation coefficient between Demand and
  is 0.956,what is the predicted demand for a price of $250 found by the model with better fit?
A) 4447.88
B) 3914.38
C) 4029.38
D) 5137.60
Correct Answer:
Verified
Q72: Exhibit 16.5.The following data shows the demand
Q73: Exhibit 16.5.The following data shows the demand
Q74: Exhibit 16.6.Thirty employed single individuals were randomly
Q75: Exhibit 16.5.The following data shows the demand
Q76: Exhibit 16.6.Thirty employed single individuals were randomly
Q78: Exhibit 16.6.Thirty employed single individuals were randomly
Q79: Exhibit 16-4.The following data shows the cooling
Q80: Exhibit 16.6.Thirty employed single individuals were randomly
Q81: Exhibit 16-7.It is believed that the sales
Q82: Exhibit 16.6.Thirty employed single individuals were randomly
Unlock this Answer For Free Now!
View this answer and more for free by performing one of the following actions

Scan the QR code to install the App and get 2 free unlocks

Unlock quizzes for free by uploading documents