Use the following to answer questions:
Refer to the graph below, showing beak size for a population of a species of Darwin's finches. 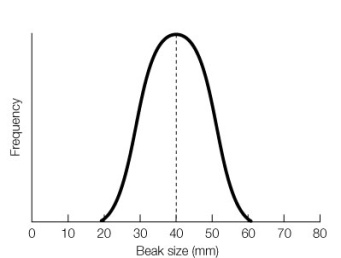
-Draw a graph showing what the resulting population would look like after a generation of strong disruptive selection.
Correct Answer:
Verified
Q100: The frequencies of different alleles at each
Q101: In several species of insects, males with
Q101: If the frequency of allele b in
Q102: When _ selection operates, individuals at opposite
Q104: The ability to taste the chemical PTC
Q106: In comparing several populations of the same
Q107: Which of the following statements about Mendelian
Q108: Allele frequencies for a gene locus are
Q109: Suppose that in a population of diploid
Q110: Which of the following evolutionary agents would
Unlock this Answer For Free Now!
View this answer and more for free by performing one of the following actions

Scan the QR code to install the App and get 2 free unlocks

Unlock quizzes for free by uploading documents