Use the following to answer questions:
Refer to the graph below. 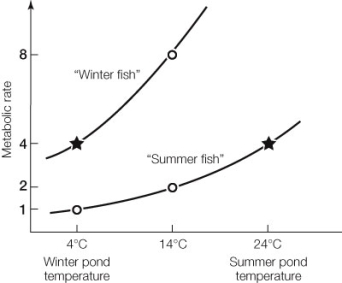
-In the experiment graphed above, the same fish were caught and brought into the lab in both winter and summer. Their metabolic rates (O2 consumption) were measured at the pond temperatures for each season ( ) and at other temperatures (') . This experiment demonstrates the phenomenon of
A) homeostasis.
B) acclimatization.
C) declimatization.
D) negative feedback.
E) None of the above
Correct Answer:
Verified
Q98: _, derived from bacteria or viruses that
Q101: Evaporative cooling is an effective way to
Q102: In fast-swimming cool-water fishes such as sharks
Q104: Which of the following organ systems is
Q105: Some animals use brown fat as a
Q106: On a hot day, an active dog
Q107: During childbirth, the pressure exerted on the
Q108: A lizard lives in a desert environment
Q109: Environmental temperature influences the body temperature of
Q114: A Q10 value of 3 indicates that
Unlock this Answer For Free Now!
View this answer and more for free by performing one of the following actions

Scan the QR code to install the App and get 2 free unlocks

Unlock quizzes for free by uploading documents