Use the following to answer questions:
Refer to the graph below. 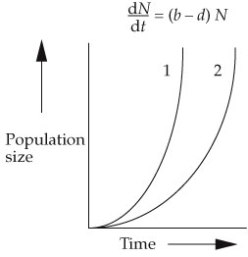
-The intrinsic rates of increase (r) of species A = 0.25 and of species B = 0.50. According to the graph, the population growth curve for A should be more like curve _______.
Correct Answer:
Verified
Q112: In an effort to measure the size
Q113: Use the following to answer questions:
Refer to
Q114: Some species of fish in the salmon
Q115: Which of the following would probably not
Q116: Use the following to answer questions :
Refer
Q118: Draw and explain survivorship curves characteristic of
Q119: Which of the following tends to be
Q120: The zebra mussel was not found in
Q121: How does the age structure of a
Q122: How do the demographic traits of fish
Unlock this Answer For Free Now!
View this answer and more for free by performing one of the following actions

Scan the QR code to install the App and get 2 free unlocks

Unlock quizzes for free by uploading documents